Updated: February 2, 2026
2026 Field Crop Budgets Crop budgets vary greatly by operation! Prices and cost estimates are averages collected from retailers across the state. Input prices will vary by crop, management, region, varieties and other criteria and may not be reflective of YOUR true costs.
Assumptions in Analysis Land charge of $110. Purchase price is not included. Operating expenses borrowed at 8.5% interest for 5 months of expenses. Fertility rates based on MCE SFM-1 guidelines Assuming medium fertility levels Fixed costs are calculated with MD Custom Rates (2025) -should use your actual fixed costs Crop insurance quotes. Actuals will not be set until March. *Any fields with resistance weeds should reconsider post application products
Budgeting Recommendations Create your own budgets and fixed costs including equipment, repairs, insurance, depreciation, interest, and taxes. Write and implement a farm business plan - setting goals, managing finances and develop markets Manage capital assets such as land and equipment Track your expenses and at the end of the year compare actual and projected Using This Spreadsheet This workbook is designed to be updated very easily. Click on the INPUTS worksheet and make changes. This will automatically update changes on other worksheets (i.e. N changes from .47 to .54 update it on the inputs page, and it automatically updates all N prices for the 5 crops) Be sure to save changes periodically and use the date in the title to mark when the budget was prepared. Questions Contact: Shannon Dill, 410-822-1244 or sdill@umd.edu Download Maryland Crop Budgets 2026 Excel Version
Inputs (2026) Table 1 - Crop Prices (Income Inputs) Crop Unit Price Year Price (USD) Notes Corn Bushel 2026 4.61 December 2026 Soybeans Bushel 2026 10.67 November 2026 Wheat Bushel 2026 5.32 July 2026
Table 2 - Seed Costs Crop/Variety Unit Price (USD) Corn – Conventional 1,000 Seeds 2.09 Corn – Roundup Ready & Bt 1,000 Seeds 3.78 Soybean 1,000 Seeds 0.24 Soybean RR II 1,000 Seeds 0.35 Soybean Enlist 1,000 Seeds 0.38 Wheat (treated) Pound 0.44
Table 3 - Fertilizer Inputs Fertilizer Type Unit Price (USD) Nitrogen Pound 0.63 Phosphorus Pound 0.76 Potash Pound 0.40 Sulfate Pound 0.89 Poultry litter Ton 25.00 Lime Ton 60.00
Table 4 - Pesticides Product Name Unit Price (USD) 2,4‑D Amine Quart 5.50 2,4‑D Ester Pint 3.82 Acuron Quart 14.00 Anthem Flex Quart 133.50 Atrazine Quart 4.75 Bicep II Magnum Pint 3.63 Boundary Pint 8.63 Callisto Ounce 0.52 Corvus Ounce 3.02 Dual II Magnum Ounce 0.51 Dual Magnum Ounce 0.38 Enlist One Pint 6.75 Flexstar GT Pint 1.93 Gramoxone SL 3.0 Pint 4.06 Halex GT Pint 6.08 Harmony SG Ounce 5.10 Interline / Generic Glufosinate Quart 4.19 Liberty Ultra Pound 9.50 Metribuzin Quart 6.51 Miravis Ace Ounce 1.86 Princep Ounce 1.45 Prosaro Ounce 1.27 Prowl H2O Quart 11.75 Reflex Pint 5.63 Roundup Ounce 0.20 Roundup Quart 6.40 Sharpen Quart 215.53 Status 56 Ounce 4.59 Stratego Ounce 2.80 Surfactant Ounce 0.21 Surfactant Quart 6.72 Tilt Ounce 0.65 Trivapro Ounce 1.33 Valor EZ Ounce 3.03 Warrant Pint 0.22 Warrior II Ounce 1.05
Table 5- Other Inputs Input Type Unit Price (USD) Soil Test Acre 0.50
Table 6- Crop Insurance Rates Crop Coverage Type Unit Rate (USD) Corn Crop insurance Acre 16.42 Corn (irrigated) Crop insurance Acre 22.78 Soybeans Crop insurance Acre 12.53
Table 7 - Drying Fuel & Handling Input Unit Rate (USD) Drying fuel and handling Bushel 0.35
Table 8 - Fixed Costs (2025 Custom Rates) Operation Unit Rate (USD) Stalk chopping Acre 27.84 Chisel plowing Acre 25.55 Disking Acre 26.64 Field cultivator / finisher Acre 25.56 Vertical tillage Acre 19.50 Fertilizer spreading Acre 11.72 Sidedressing Acre 13.78 Manure loading Ton 6.58 Manure spreading – litter Ton 12.49 Manure hauling Ton 8.85 Pesticide spraying Acre 14.01 No‑till drilling Acre 23.43 Small grain planting Acre 23.43 Planting – corn (conventional) Acre 27.23 Planting – corn (no‑till) Acre 27.57 Planting – soybeans (conventional) Acre 29.13 Planting – soybeans (no‑till) Acre 27.10 Broadcast seeding – small grain Acre 12.60 Harvesting – corn Acre 40.03 Harvesting – soybeans Acre 39.63 Harvesting – wheat Acre 39.55 Hauling Bushel 0.19
Table 9 - Land Charge Input Unit Rate (USD) Land charge Acre 110.00
back to top
Corn Grain, No Till, Non-Irrigated (2026) Table 1 - Gross Income Item Unit Quantity Price (USD) Total (USD) Corn Grain Bushel 160 4.61 737.60
Table 2 - Variable Costs Item Unit Quantity Price (USD) Total (USD) Seed RR + Bt 1000 Seeds 30 3.78 113.40 Soil Test Acre 1 0.50 0.50 Nitrogen Pound 160 0.63 100.80 Phosphate Pound 30 0.76 22.80 Potash Pound 60 0.40 23.70 Lime Ton 0.5 60.00 30.00 Gramoxone SL 3.0 Pint 2 4.06 8.12 Corvus Ounce 4 3.02 12.06 Atrazine Quart 0.5 4.75 2.38 Roundup (POST)* Quart 1 6.40 6.40 Princep Quart 1 1.45 1.45 Crop Insurance (RP 70%) Acre 1 16.42 16.42 Drying Fuel Bushel 160 0.36 57.60 *Interest on Operating Capital — — — 14.37 Total Variable Costs — — — 409.99
*Interest on Operating Capital - Unit (USD): 338.03, Quantity: 0.5, and Percentage: 8.5%, and Total (USD): 14.37
Table 3 - Fixed/Overhead Costs (custom Rates are used as proxy for field operation costs) Item Unit Quantity Price (USD) Total (USD) Fertilizer Spreading Acre 1 11.72 11.72 No‑till Planting (with fertilizer) Acre 1 27.57 27.57 Nitrogen Application Acre 1 13.78 13.78 Pesticide Applications Acre 2 14.01 28.02 Harvesting Acre 1 40.03 40.03 Hauling Bushel 160 0.19 30.40 *Interest on Spring Custom Charges — — — 3.45 Land Charge Acre 1 110.00 110.00 Total Fixed Costs — — — 264.97
*Interest on Spring Custom Charges - Unit (USD): 81.09, Quantity: 0.5, and Percentage: 8.5%, and Total (USD): 3.45
Table 4 - Cost Summary Category Amount (USD per acre) Gross Income 737.60 Total Costs (variable and fixed) 674.96 Net Income 62.64
Table 5 - Sensitivity Analysis (Prices 12%) Yield (bushels/acre) 25% Price $4.06 Price $4.61 Price $5.16 120 -188.14 -121.76 -55.37 160 -25.87 62.64 151.15 200 136.40 247.04 357.68
Assumptions Non-continuous corn soil insecticide may not be necessary. If following beans add 20 lb N credit Local hauling within 30 miles of farm Fertility rates based on MCE SFM-1 guidelines Assuming medium fertility levels Bt seed corn, hybrid, mid price grade *Any fields with resistant weeds should reconsider post-application products Sensitivity analysis based on 75%,100% and 125% of typical yield and 12% current forward contract price. back to top
Corn Grain, Conventional Till, Non-Irrigated (2026) Table 1 - Gross Income Item Unit Quantity Price (USD) Total (USD) Corn Grain Bushel 160 4.61 737.60
Table 2 - Variable Costs Item Unit Quantity Price (USD) Total (USD) Seed RR + Bt 1000 Seeds 30 3.78 113.40 Soil Test Acre 1 0.50 0.50 Nitrogen Pound 160 0.63 100.80 Phosphate Pound 30 0.76 22.80 Potash Pound 60 0.40 23.70 Lime Ton 0.5 60.00 30.00 Corvus Ounce 4 3.02 12.06 Atrazine Quart 0.5 4.75 2.38 Princep Quart 1 1.45 1.45 Roundup (POST)* Quart 1 6.40 6.40 Crop Insurance (RP 70%) Acre 1 16.42 16.42 Drying Fuel Bushel 160 0.36 57.60 *Interest on Operating Capital — — — 14.02 Total Variable Costs — — — 401.53
*Interest on Operating Capital - Unit (USD): 329.91, Quantity: 0.5, and Percentage: 8.5%, and Total (USD): 14.02
Table 3 - fixed/Overhead Costs (custom Rates are used as proxy for field operation costs) Item Unit Quantity Price (USD) Total (USD) Chisel Plowing Acre 1 25.55 25.55 Disking Acre 1 26.64 26.64 Field Cultivator/Finisher Acre 1 25.56 25.56 Fertilizer Spreading Acre 1 11.72 11.72 Planting with Fertilizer Acre 1 27.23 27.23 Nitrogen Application Acre 1 13.78 13.78 Pesticide Applications Acre 2 14.01 28.02 Harvesting Acre 1 40.03 40.03 Hauling Bushel 160 0.19 30.40 *Interest on Spring Custom Charges — — — 6.74 Land Charge Acre 1 110.00 110.00 Total Fixed Costs — — — 345.67
*Interest on Spring Custom Charges - Unit (USD): 158.50, Quantity: 0.5, and Percentage: 8.5%, and Total (USD): 6.74
Table 4 - Cost Summary Category Amount (USD per acre) Gross Income 737.60 Total Costs (variable and fixed) 747.19 Net Income -9.59
Table 5 - Sensitivity Analysis (Prices 12%) Yield (bushels/acre) 25% Price $4.06 Price $4.61 Price $5.16 120 -260.38 -193.99 -127.61 160 -98.10 -9.59 78.92 200 64.17 174.81 285.45
Assumptions Non-continuous corn soil insecticide may not be necessary. Local hauling within 30 miles of farm Fertility rates based on MCE SFM-1 guidelines Assuming medium fertility levels Bt seed corn, hybrid, mid price grade *Any fields with resistant weeds should reconsider post-application products Sensitivity analysis based on 75%,100% and 125% of typical yield and 12% current forward contract price. back to top
Corn Grain, No Till, Irrigated Table 1 - Gross Income Item Unit Quantity Price (USD) Total (USD) Corn Grain Bushel 230 4.61 1,060.30
Table 2 - Variable Costs Item Unit Quantity Price (USD) Total (USD) Seed RR + Bt 1000 Seeds 36 3.78 136.08 Soil Test Acre 1 0.50 0.50 Nitrogen Pound 230 0.63 144.90 Phosphate Pound 45 0.76 34.20 Potash Pound 100 0.40 39.50 Lime Ton 0.5 60.00 30.00 Flexstar GT Pint 1.5 1.93 2.90 Corvus Ounce 4 3.02 12.06 Atrazine Quart 0.5 4.75 2.38 Roundup (POST)* Quart 1 6.40 6.40 Stratego Ounce 4 2.80 11.20 Princep Quart 1 1.45 1.45 Crop Insurance (RP 70%) Acre 1 22.78 22.78 Drying Fuel Bushel 230 0.35 80.50 Irrigation Expense (electric, fuel, etc.) Inch 10 7.78 77.80 Irrigation Repair and Maintenance Acre 1 10.00 10.00 *Interest on Operating Capital — — — 18.88 Total Variable Costs — — — 631.52
*Interest on Operating Capital - Unit (USD): 444.34, Quantity: 0.5, and Percentage: 8.5%, and Total (USD): 18.88
Table 3 - fixed/Overhead Costs (custom Rates are used as proxy for field operation costs) Item Unit Quantity Price (USD) Total (USD) Fertilizer Spreading Acre 1 11.72 11.72 No Till Planting with Fertilizer Acre 1 27.57 27.57 Nitrogen Application Acre 1 13.78 13.78 Pesticide Applications Acre 2 14.01 28.02 Harvesting Acre 1 40.03 40.03 Hauling Bushel 230 0.19 43.70 *Interest on Spring Custom Charges — — — 3.45 Irrigation Payment (including interest) Acre 1 150.00 150.00 Land Charge Acre 1 110.00 110.00 Total Fixed Costs — — — 428.27
*Interest on Spring Custom Charges - Unit (USD): 81.09, Quantity: 0.5, and Percentage: 8.5%, and Total (USD): 3.45
Table 4 - Cost Summary Category Amount (USD per acre) Gross Income 1,060.30 Total Costs (variable & fixed)1,059.79 Net Income .51
Table 5 - Sensitivity Analysis (Prices 12%) Yield (bushels/acre) 25% Price $4.06 Price $4.61 Price $5.16 172.5 -359.99 -264.57 -169.14 230 -126.73 0.51 127.75 287.5 106.54 265.58 424.63
Assumptions Non-continuous corn soil insecticide may not be necessary. Local hauling within 30 miles of farm Fertility rates based on MCE SFM-1 guidelines Assuming medium fertility levels Bt seed corn, hybrid, mid price grade *Any fields with resistant weeds should reconsider post-application products Sensitivity analysis based on 75%,100% and 125% of typical yield and 12% current forward contract price. back to top
Corn Grain, No Till, Poultry Litter (2026) Table 1 - Gross Income Item Unit Quantity Price (USD) Total (USD) Corn Grain Bushel 160 4.61 737.60
Table 2 - Variable Costs Item Unit Quantity Price (USD) Total (USD) Seed RR + Bt 1000 Seeds 30 3.78 113.40 Soil Test Acre 1 0.50 0.50 Nitrogen Pound 80 0.63 50.40 Phosphate 0 0.76 0.00 Potash Pound 0 0.40 0.00 Poultry Litter (57-99-113) Ton 2 25.00 50.00 Lime Ton 0.5 60.00 30.00 Flexstar GT Pint 1.5 1.93 2.90 Corvus Ounce 4 3.02 12.06 Atrazine Quart 0.5 4.75 2.38 Roundup (POST)* Quart 1 6.40 6.40 Princep Quart 1 1.45 1.45 Crop Insurance (RP 70%) Acre 1 16.42 16.42 Drying Fuel Bushel 160 0.35 56.00 *Interest on Operating Capital — — — 12.15 Total Variable Costs — — — 354.05
*Interest on Operating Capital - Unit (USD): 285.90, Quantity: 0.5, and Percentage: 8.5%, and Total (USD): 12.15
Table 3 - fixed/Overhead Costs (custom Rates are used as proxy for field operation costs) Item Unit Quantity Price (USD) Total (USD) Manure Hauling Ton 2 8.85 17.70 Manure Loading Ton 2 6.58 13.16 Manure Spreading - Litter Ton 2 12.49 24.98 Minimal Tillage Acre 1 19.50 19.50 No Till Planting Acre 1 27.57 27.57 Nitrogen Application Acre 1 13.78 13.78 Pesticide Applications Acre 2 14.01 28.02 Harvesting Acre 1 40.03 40.03 Hauling Bushel 160 0.19 30.40 *Interest on Spring Custom Charges — — — 5.40 Land Charge Acre 1 110.00 110.00 Total Fixed Costs — — — 330.54
*Interest on Spring Custom Charges - Unit (USD): 127.01, Quantity: 0.5, and Percentage: 8.5%, and Total (USD): 5.40
Table 4 - Cost Summary Category Amount (USD per acre) Gross Income 737.60 Total Costs (variable & fixed)684.59 Net Income 53.01
Table 5 - Sensitivity Analysis (Prices 12%) Yield (bushels/acre) 25% Price $4.06 Price $4.61 Price $5.16 120 -197.77 -131.39 -65.00 160 -35.50 53.01 141.52 200 126.77 237.41 348.05
Assumptions Non-continuous corn soil insecticide may not be necessary. If following beans add 20 lb N credit Local hauling within 30 miles of farm Fertility rates based on MCE SFM-1 guidelines Assuming medium fertility levels Bt seed corn, hybrid, mid price grade Poultry litter estimates - Economic Value of Poultry Litter 2002. Lichtenberg, Parker, Lynch. Litter will provide nitrogen availability at year 2 20% and year 3 5% *Any fields with resistant weeds should reconsider post-application products Sensitivity analysis based on 75%,100% and 125% of typical yield and 12% current forward contract price. back to top
Corn Grain, No Till, Non-IRR with Weed Resistance (2026) Table 1 - Gross Income Item Unit Quantity Price (USD) Total (USD) Corn Grain Bushel 160 4.61 737.60
Table 2 - Variable Costs Item Unit Quantity Price (USD) Total (USD) Seed RR + Bt 1000 Seeds 30 3.78 113.40 Soil Test Acre 1 0.50 0.50 Nitrogen Pound 160 0.63 100.80 Phosphate Pound 30 0.76 22.80 Potash Pound 60 0.40 23.70 Lime Ton 0.5 60.00 30.00 Flexstar GT Pint 1.5 1.93 2.90 Atrazine Quart 0.5 4.75 2.38 Princep Quart 1 1.45 1.45 Halex GT Pint 4 6.08 24.32 Status 56 WDG Ounce 4 1.05 4.20 Crop Insurance (RP 70%) Acre 1 16.42 16.42 Drying Fuel Bushel 160 0.36 57.60 *Interest on Operating Capital — — — 14.57 Total Variable Costs — — — 415.03
*Interest on Operating Capital - Unit (USD): 342.86, Quantity: 0.5, and Percentage: 8.5%, and Total (USD): 14.57
Table 3 - fixed/Overhead Costs (custom Rates are used as proxy for field operation costs) Item Unit Quantity Price (USD) Total (USD) Fertilizer Spreading Acre 1 11.72 11.72 No Till Planting With Fertilizer Acre 1 27.57 27.57 Nitrogen Application Acre 1 13.78 13.78 Pesticide Applications Acre 3 14.01 42.03 Harvesting Acre 1 40.03 40.03 Hauling Bushel 160 0.19 30.40 *Interest on Spring Custom Charges — — — 4.04 Land Charge Acre 1 110.00 110.00 Total Fixed Costs — — — 279.57
*Interest on Spring Custom Charges - Unit (USD): 95.10, Quantity: 0.5, and Percentage: 8.5%, and Total (USD): 4.04
Table 4 - Cost Summary Category Amount (USD per acre) Gross Income 737.60 Total Costs (variable & fixed)694.60 Net Income 43.00
Table 5 - Sensitivity Analysis (Prices 12%) Yield (bushels/acre) 25% Price $4.06 Price $4.61 Price $5.16 120 -207.79 -141.40 -75.02 160 -45.52 43.00 131.51 200 116.76 227.40 338.04
Assumptions Non-continuous corn soil insecticide may not be necessary. If following beans add 20 lb N credit Local hauling within 30 miles of farm Fertility rates based on MCE SFM-1 guidelines Assuming medium fertility levels Bt seed corn, hybrid, mid price grade Sensitivity analysis based on 75%,100% and 125% of typical yield and 12% current forward contract price.
Soybeans RR (2026) Table 1 - Gross Income Item Unit Quantity Price (USD) Total (USD) Soybeans Bushel 60 10.67 640.20
Table 2 - Variable Costs Item Unit Quantity Price (USD) Total (USD) Seed 1000 Seeds 150 0.35 52.50 Soil Testing Acre 1 0.50 0.50 Phosphate Pound 45 0.76 34.20 Potash Pound 40 0.40 15.80 Lime Ton 0.5 60.00 30.00 Flexstar GT Pint 2 1.93 3.86 Valor EZ Ounce 3 3.03 9.09 2 4-D Pint 1 3.82 3.82 Roundup (2 passes)* Quart 2 6.40 12.80 Reflex Pint 1.5 5.63 8.45 Warrior II Ounce 1.92 1.05 2.02 Crop Insurance (RP 70%) Acre 1 12.53 12.53 *Interest on Operating Capital — — — 7.89 Total Variable Costs — — — 193.44
*Interest on Operating Capital - Unit (USD): 185.56, Quantity: 0.5, and Percentage: 8.5%, and Total (USD): 7.89
Table 3 - fixed/Overhead Costs (custom Rates are used as proxy for field operation costs) Item Unit Quantity Price (USD) Total (USD) Fertilizer Application Acre 1 11.72 11.72 Soybean No Till Acre 1 27.10 27.10 Pesticide Applications Acre 3 14.01 42.03 Harvesting Acre 1 39.63 39.63 Hauling Bushel 60 0.19 11.40 *Interest on Spring Custom Charges — — — 3.44 Land Charge Acre 1 110.00 110.00 Total Fixed Costs — — — 245.32
*Interest on Spring Custom Charges - Unit (USD): 80.85, Quantity: 0.5, and Percentage: 8.5%, and Total (USD): 3.44
Table 4 - Cost Summary Category Amount (USD per acre) Gross Income 640.20 Total Costs (variable & fixed)438.76 Net Income 201.44
Table 5 - Sensitivity Analysis (Prices 12%) Yield (bushels/acre) 25% Price $9.39 Price $10.67 Price $11.95 45 -16.23 41.39 99.01 60 124.62 201.44 278.27 75 265.46 361.49 457.52
Assumptions Fertility rates based on MCE SFM-1 guidelines Assuming medium fertility levels Local hauling within 30 miles of farm *Any fields with resistant weeds should reconsider post-application products Sensitivity analysis based on 75%,100% and 125% of typical yield and 12% current forward contract price.
Soybeans Herbicide Tolerant, with Weed Resistance (2026) Table 1 - Gross Income Item Unit Quantity Price (USD) Total (USD) Soybeans Bushel 60 10.67 640.20
Table 2 - Variable Costs Item Unit Quantity Price (USD) Total (USD) Seed 1000 Seeds 150 0.35 52.50 Soil Testing Acre 1 0.50 0.50 Phosphate Pound 45 0.76 34.20 Potash Pound 40 0.40 15.80 Lime Ton 0.5 60.00 30.00 Gramoxone SL 3.0 Pint 2 4.06 8.12 2 4-D Pint 1 3.82 3.82 Valor EZ Ounce 3 3.03 9.09 Warrior II Ounce 1.92 1.05 2.02 Dual II Magnum Ounce 20 0.51 10.10 Enlist One Pint 2 6.75 13.50 Crop Insurance (RP 70%) Acre 1 12.53 12.53 *Interest on Operating Capital — — — 8.17 Total Variable Costs — — — 200.34
*Interest on Operating Capital - Unit (USD): 192.17, Quantity: 0.5, and Percentage: 8.5%, and Total (USD): 8.17
Table 3 - fixed/Overhead Costs (custom Rates are used as proxy for field operation costs) Item Unit Quantity Price (USD) Total (USD) Fertilizer Application Acre 1 11.72 11.72 Soybean No Till Planting Acre 1 27.10 27.10 Pesticide Applications Acre 3 14.01 42.03 Harvesting Acre 1 39.63 39.63 Hauling Bushel 60 0.19 11.40 *Interest on Spring Custom Charges — — — 3.44 Land Charge Acre 1 110.00 110.00 Total Fixed Costs — — — 245.32
*Interest on Spring Custom Charges - Unit (USD): 80.85, Quantity: 0.5, and Percentage: 8.5%, and Total (USD): 3.44
Table 4 - Cost Summary Category Amount (USD per acre) Gross Income 640.20 Total Costs (variable & fixed)445.65 Net Income 194.55
Table 5 - Sensitivity Analysis (Prices 12%) Yield (bushels/acre) 25% Price $9.39 Price $10.67 Price $11.95 45 -23.12 34.50 92.11 60 117.72 194.55 271.37 75 258.57 354.60 450.63
Assumptions Fertility rates based on MCE SFM-1 guidelines Assuming medium fertility levels Local hauling within 30 miles of farm *Any fields with resistant weeds should reconsider post-application products Sensitivity analysis based on 75%,100% and 125% of typical yield and 12% current forward contract price. back to top
Wheat (2026) Table 1 - Gross Income Item Unit Quantity Price (USD) Total (USD) Wheat Bushel 75 5.32 399.00
Table 2 - Variable Costs Item Unit Quantity Price (USD) Total (USD) Seed Pound 150 0.44 66.00 Soil Testing Acre 1 0.50 0.50 Nitrogen Pound 70 0.63 44.10 Phosphate Pound 40 0.76 30.40 Potash Pound 40 0.40 15.80 Lime Ton 0.5 60.00 30.00 Harmony SG Ounce 0.8 5.10 4.08 Surfactant Quart 1 6.72 6.72 Tilt Ounce 2 0.65 1.30 Zidua Ounce 1.5 5.30 7.95 Prosaro Ounce 6.5 1.27 8.26 Warrior II Ounce 3 1.05 3.15 Crop Insurance (RP 70%) Acre 1 10.22 10.22 *Interest on Operating Capital — — — 9.71 Total Variable Costs — — — 238.18
*Interest on Operating Capital - Unit (USD): 228.47, Quantity: 0.5, and Percentage: 8.5%, and Total (USD): 9.71
Table 3 - fixed/Overhead Costs (custom Rates are used as proxy for field operation costs) Item Unit Quantity Price (USD) Total (USD) Spreading Fertilizer Acre 1 11.72 11.72 Vertical Tillage Acre 2 19.50 39.00 Broadcast Seeding Acre 1 12.60 12.60 Pesticide Application Acre 2 14.01 28.02 Harvesting Acre 1 39.55 39.55 Hauling Bushel 75 0.19 14.25 *Interest on Spring Custom Charges — — — 3.88 Land Charge Acre 1 110.00 110.00 Total Fixed Costs — — — 259.02
*Interest on Spring Custom Charges - Unit (USD): 91.34, Quantity: 0.5, and Percentage: 8.5%, and Total (USD): 3.88
Table 4 - Cost Summary Category Amount (USD per acre) Gross Income 399.00 Total Costs (variable & fixed)497.20 Net Income -98.20
Table 5 - Sensitivity Analysis (Prices 12%) Yield (bushels/acre) 25% Price $4.68 Price $5.32 Price $5.96 56.25 -233.86 -197.95 -162.04 75 -146.08 -98.20 -50.32 93.75 -58.30 1.55 61.40
Assumptions Local hauling within 30 miles of farm Fertility rates based on MCE SFM-1 guidelines Assuming medium fertility levels Sensitivity analysis based on 75%,100% and 125% of typical yield and 12% current forward contract price. back to top
Wheat/Soybean Double Crop (2026) Table 1 - Gross Income Item Unit Quantity Price (USD) Total (USD) Wheat Bushel 75 5.32 399.00 Soybeans Bushel 50 10.67 533.50 Total - - - 932.50
Table 2 - Variable Costs Item Unit Quantity Price (USD) Total (USD) Seed - Wheat Pound 150 0.44 66.00 Seed - Soybeans 1000 Seeds 175 0.35 61.25 Soil Testing Acre 1 0.50 0.50 Nitrogen Pound 70 0.63 44.10 Phosphate Pound 85 0.76 64.60 Potash Pound 75 0.40 29.63 Lime Ton 0.5 60.00 30.00 Harmony SG Ounce 0.5 5.10 2.55 Zidua Ounce 1.5 5.30 3.03 Surfactant Quart 1 6.72 6.72 Tilt Ounce 2 0.65 1.30 Warrior II Ounce 3.84 1.05 4.03 2 4-D Pint 1 3.82 3.82 Prosaro Ounce 6.5 1.27 8.26 Roundup Quart 1 6.40 6.40 Crop Insurance-Wheat (RP 70%) Acre 1.00 10.22 10.22 Crop Insurance-Soybeans (RP 70%) Acre 1.00 12.53 12.53 *Interest on Operating Capital — — — 15.08 Total Variable Costs — — — 370.01
*Interest on Operating Capital - Unit (USD): 354.92, Quantity: 0.5, and Percentage: 8.5%, and Total (USD): 15.08
Table 3 - fixed/Overhead Costs (custom Rates are used as proxy for field operation costs) Item Unit Quantity Price (USD) Total (USD) Spreading Fertilizer Acre 2 11.72 23.44 Vertical Tillage Acre 2 19.50 39.00 Broadcast Seeding Acre 1 12.60 12.60 No Till Drilling Acre 1 23.43 23.43 Pesticide Application Acre 4 14.01 56.04 Harvesting Acre 2 39.55 79.10 Hauling Bushel 125 0.19 23.75 *Interest on Spring Custom Charges — — — 6.57 Land Charge Acre 1 110.00 110.00 Total Fixed Costs — — — 373.93
*Interest on Spring Custom Charges - Unit (USD): 154.51, Quantity: 0.5, and Percentage: 8.5%, and Total (USD): 6.57
Table 4 - Cost Summary Category Amount (USD per acre) Gross Income 932.50 Total Costs (variable & fixed)743.93 Net Income 188.57
Net Income Above Variable and Fixed Costs for Various Yields and Prices (12%) Wheat Bean 4.68/9.39 5.32/10.67 5.96/11.95 56 38 ($128.48) ($44.56) $39.37 75 50 $76.67 $188.57 $300.47 94 63 $281.82 $421.69 $561.57
Assumptions Local hauling within 30 miles of farm Fertility rates based on MCE SFM-1 guidelines Assuming medium fertility levels Sensitivity analysis based on 75%,100% and 125% of typical yield and 12% current forward contract price. back to top
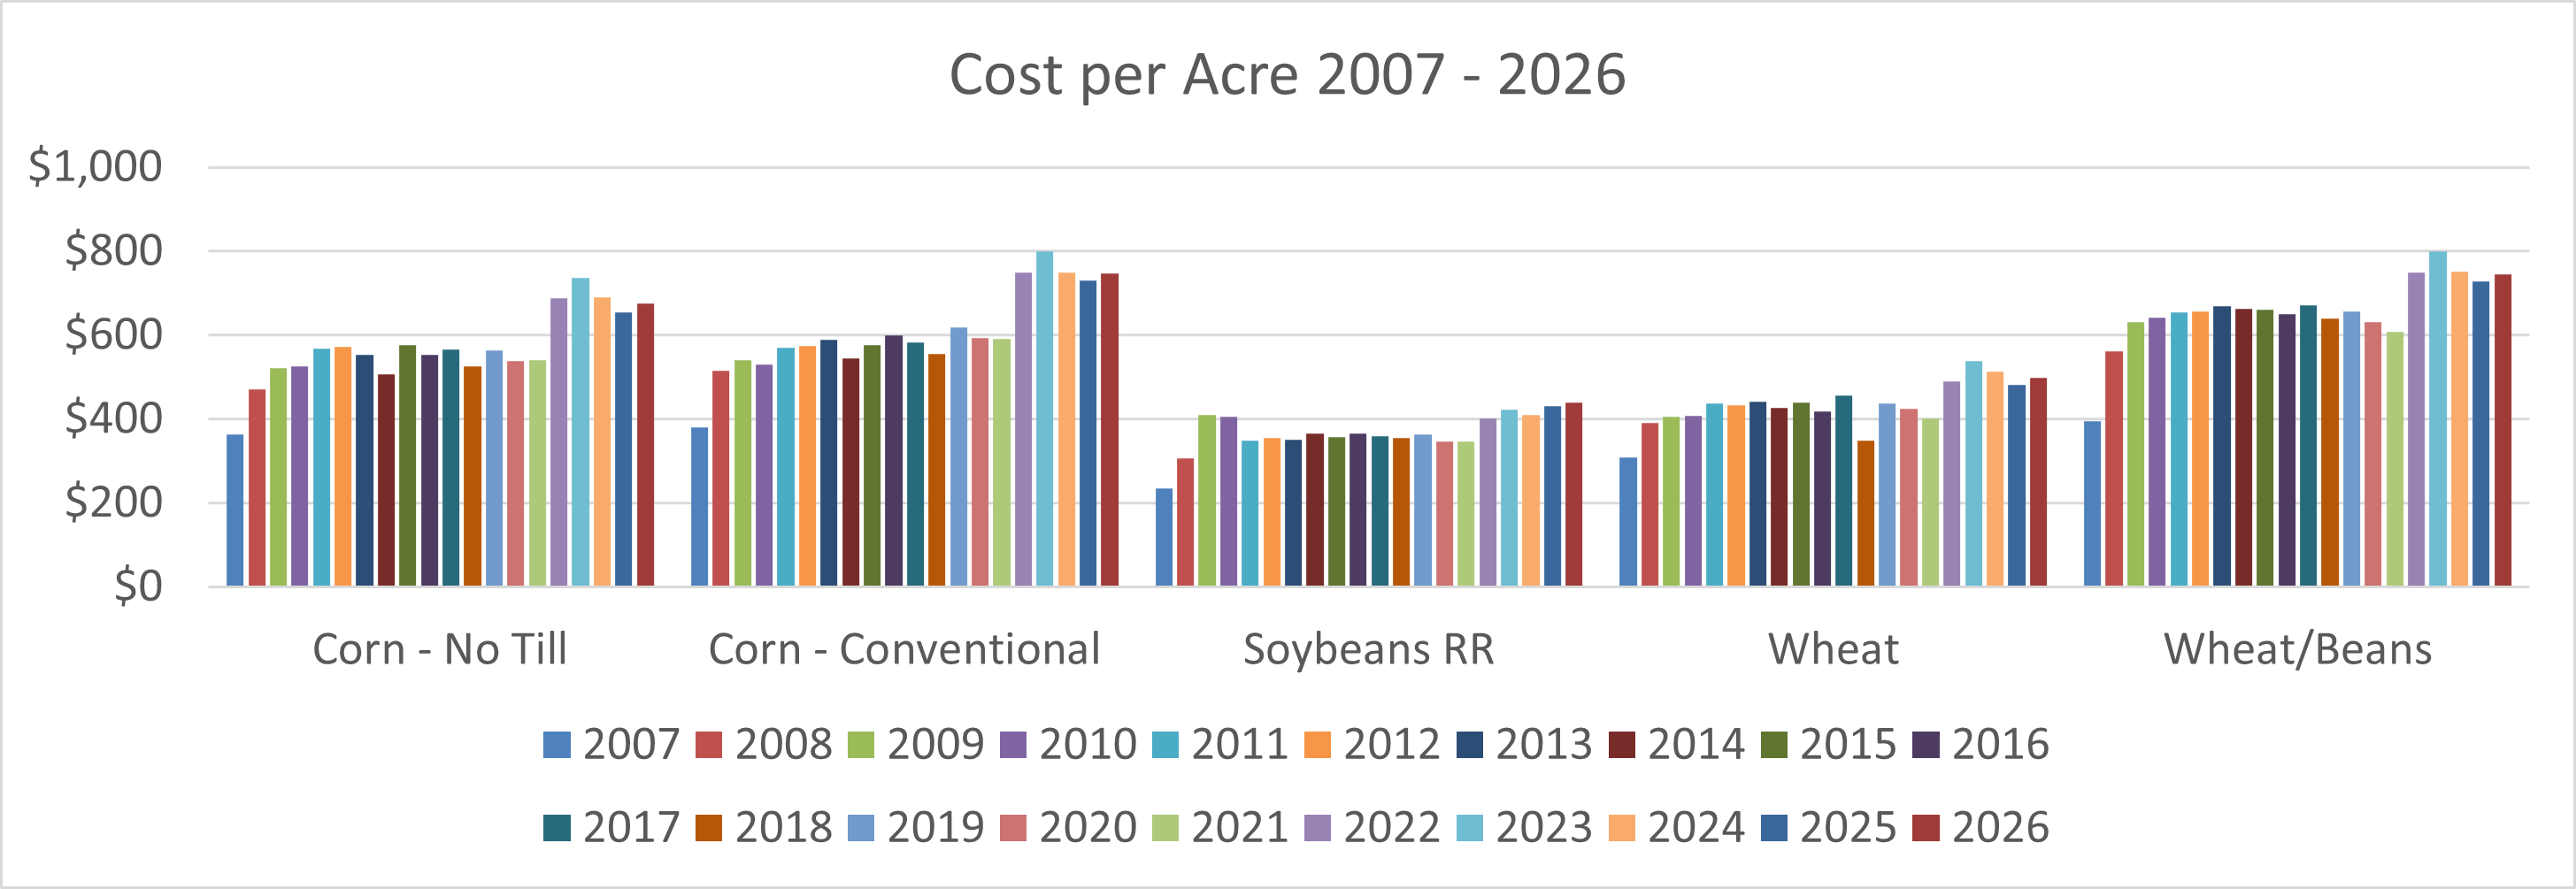
Historical Cost Per Acre YEAR CORN-NO-TILL CORN-CONVENTIONAL SOYBEANS WHEAT WHEAT/BEANS 2007 $362 $379 $234 $309 $396 2008 $471 $515 $307 $390 $562 2009 $521 $540 $411 $406 $631 2010 $525 $530 $406 $407 $641 2011 $569 $569 $348 $437 $654 2012 $573 $573 $356 $433 $656 2013 $553 $589 $350 $442 $670 2014 $507 $546 $365 $427 $662 2015 $576 $577 $358 $440 $660 2016 $552 $599 $365 $418 $649 2017 $566 $582 $358 $457 $672 2018 $526 $555 $355 $349 $639 2019 $564 $619 $363 $437 $656 2020 $538 $594 $347 $424 $631 2021 $540 $592 $346 $401 $608 2022 $698 $749 $402 $490 $749 2023 $736 $800 $423 $538 $800 2024 $690 $749 $410 $514 $752 2025 $655 $731 $431 $481 $727 2026 $675 $747 $439 $497 $744
** Historical Chart is based on prices in the January-March of each year
Bar chart showing annual production costs for five cropping systems: Corn – No Till, Corn – Conventional, Soybeans RR, Wheat, and Wheat/Beans. Each crop group displays a series of bars representing yearly costs from 2007 through 2026. Costs generally rise over time. Corn – Conventional and Corn – No Till show the highest peak costs, reaching around $750–$800 per acre in later years. Soybeans RR remains the lowest‑cost system, generally between $300 and $450 per acre. Wheat and Wheat/Beans show moderate increases, with Wheat/Beans reaching about $800 per acre by 2026.
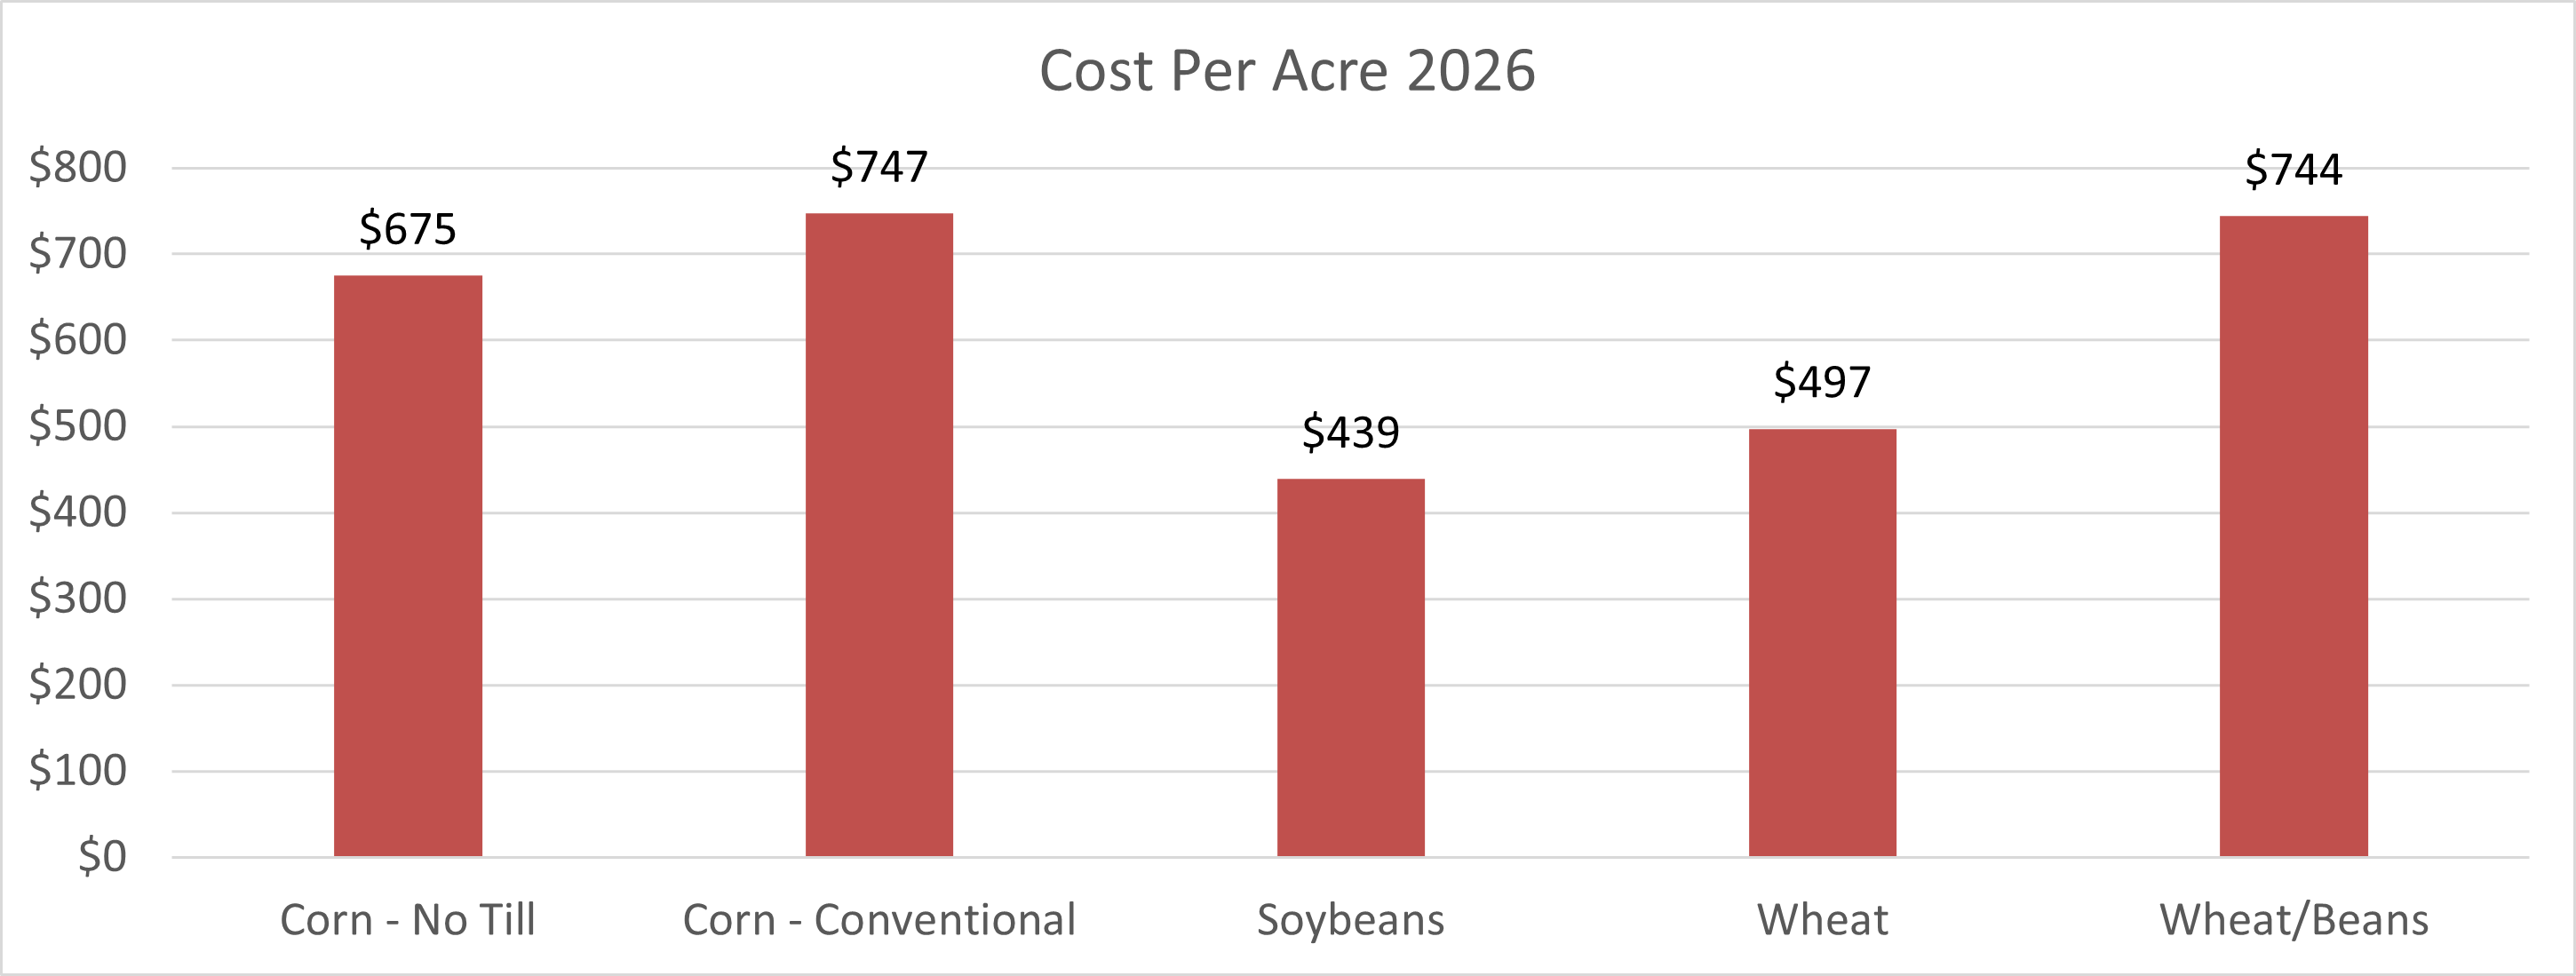
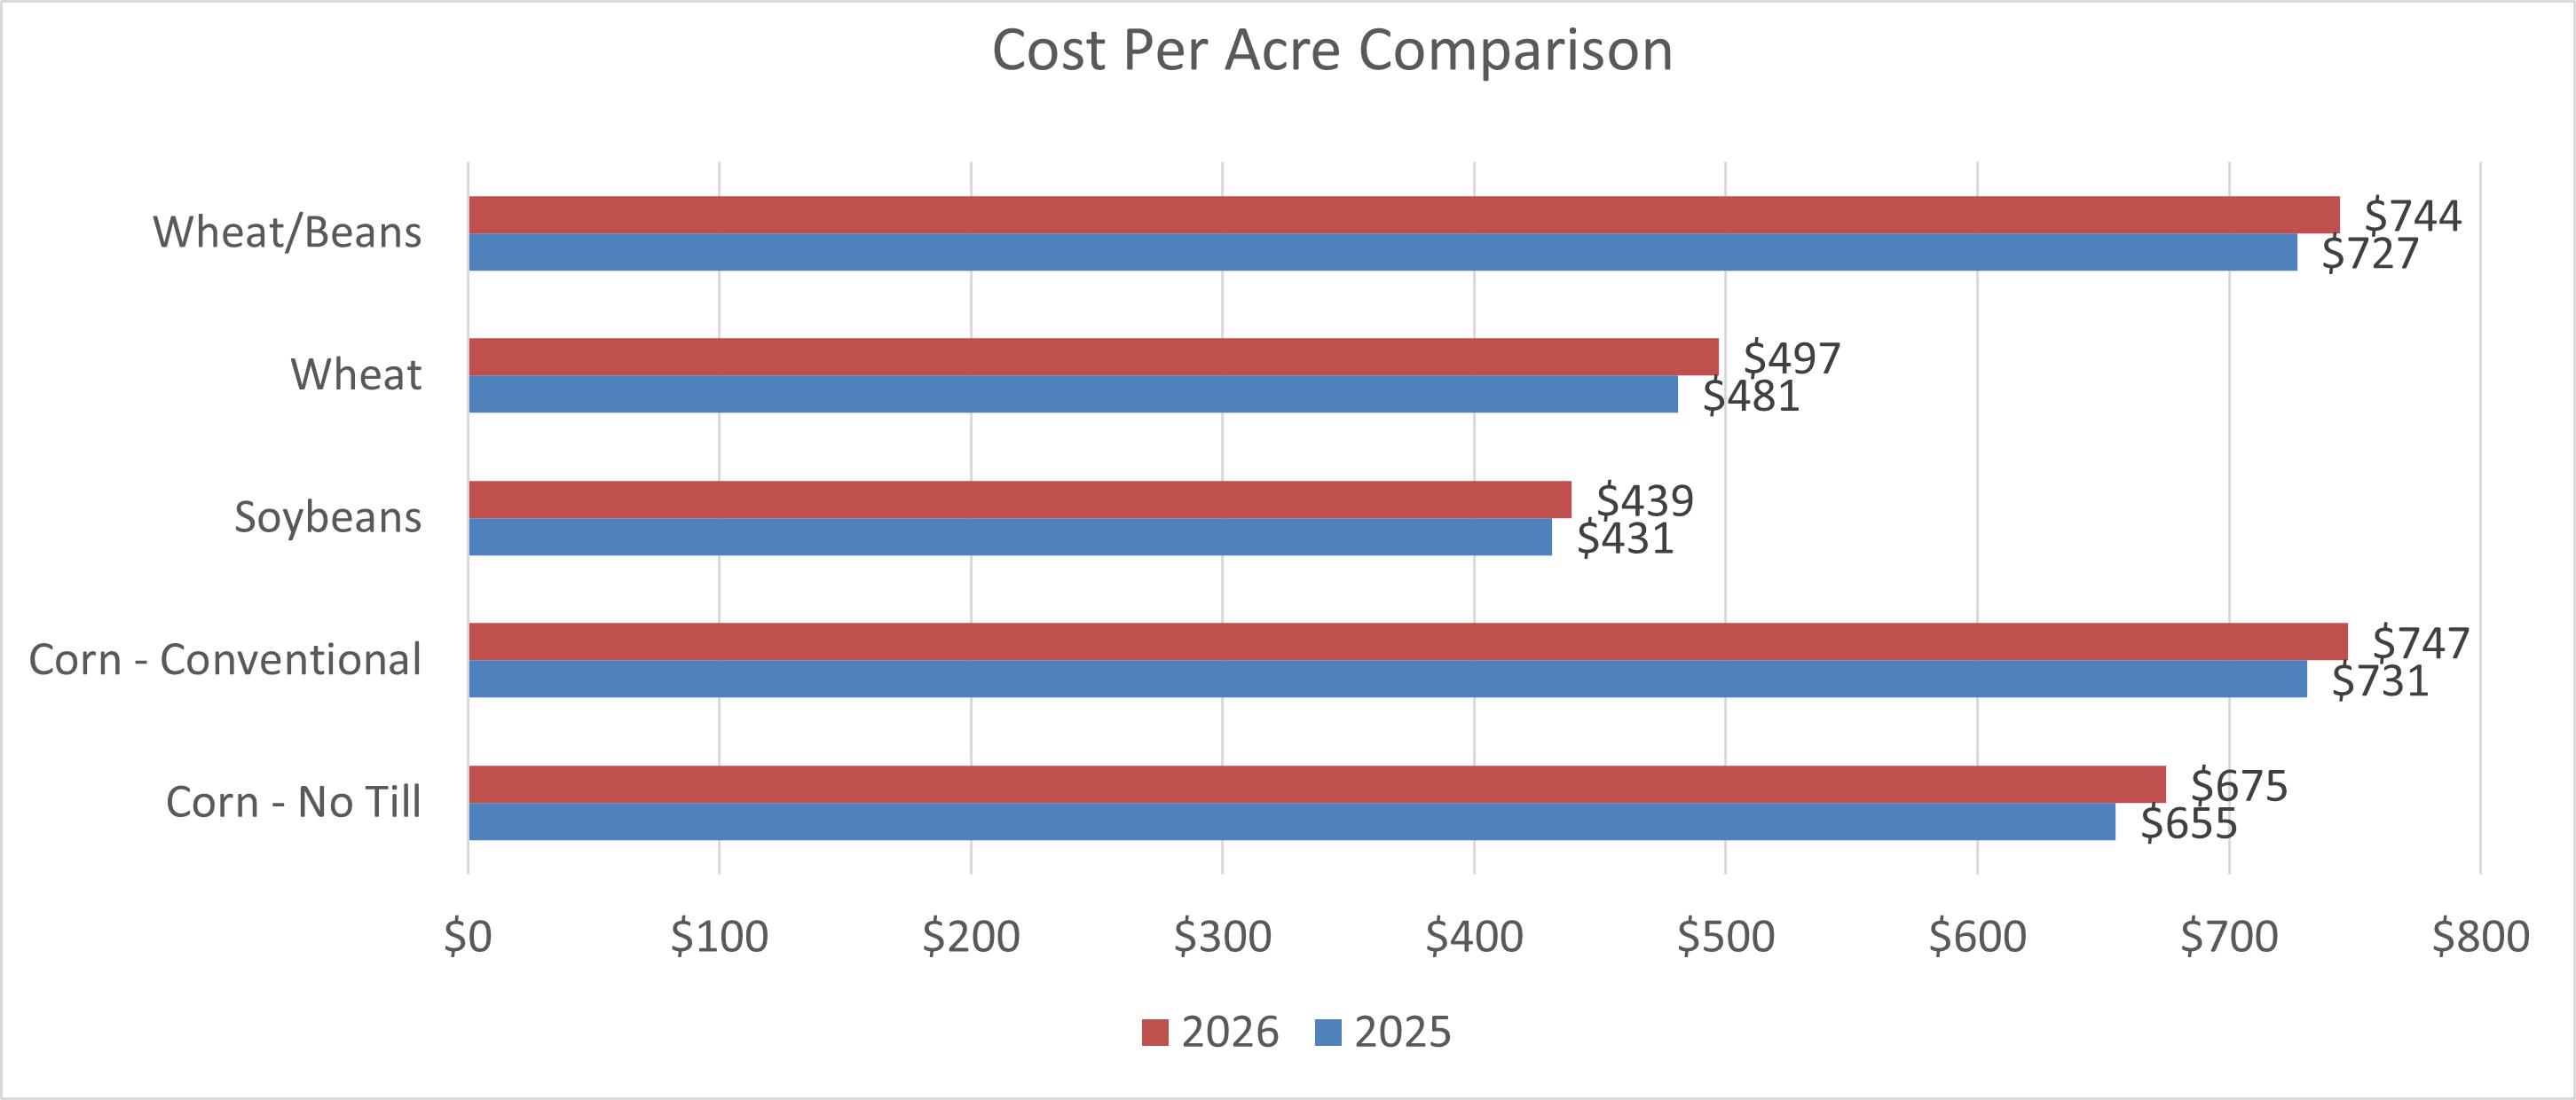
Cost Per Acre 2026 YEAR CORN-NO-TILL CORN-CONVENTIONAL SOYBEANS WHEAT WHEAT/BEANS 2025 $655 $731 $431 $481 $727 2026 $675 $747 $439 $497 $744 Difference $20 $16 $8 $16 $17 Percent Change 3% 2% 2% 3% 2%
Bar chart showing production costs for five cropping systems: Corn – No Till $675, Corn – Conventional $747, Soybeans $439, Wheat $497, and Wheat/Beans $744.
Horizontal bar chart showing 2026 versus 2025 costs for five cropping systems. Corn – No Till: $675 in 2026 and $655 in 2025. Corn – Conventional: $747 in 2026 and $731 in 2025. Soybeans: $439 in 2026 and $431 in 2025. Wheat: $497 in 2026 and $481 in 2025. Wheat/Beans: $744 in 2026 and $727 in 2025.
Questions Contact: Shannon Dill, 410-822-1244 or sdill@umd.eduwww.go.umd.edu/grainmarketing
Budgets were developed by Shannon Dill, Jenny Rhodes, Ben Beale, Dale Johnson, Jim Lewis
Disclaimer Reference in this publication to any specific commercial product, process, or service, or the use of any trade, firm, or corporation name is for general informational purposes only and does not constitute an endorsement, recommendation, or certification. Persons using such products assume responsibility for their use in accordance with current directions of the manufacturer.
EQUAL ACCESS PROGRAMS