Maryland’s “climate stripes”. Each vertical bar represents the temperature of a year from 1895 – 2020. The colors represent the annual temperature relative to the average between 1951 – 1980 (blue is cooler than the average, orange/red is hotter). An interactive version of the plot shows the temperature for each year relative to the average: http://berkeleyearth.lbl.gov/regions/maryland
Key points about climate change and how it is affecting the Maryland gardening environment
Climate change is already causing significant impacts in Maryland, including
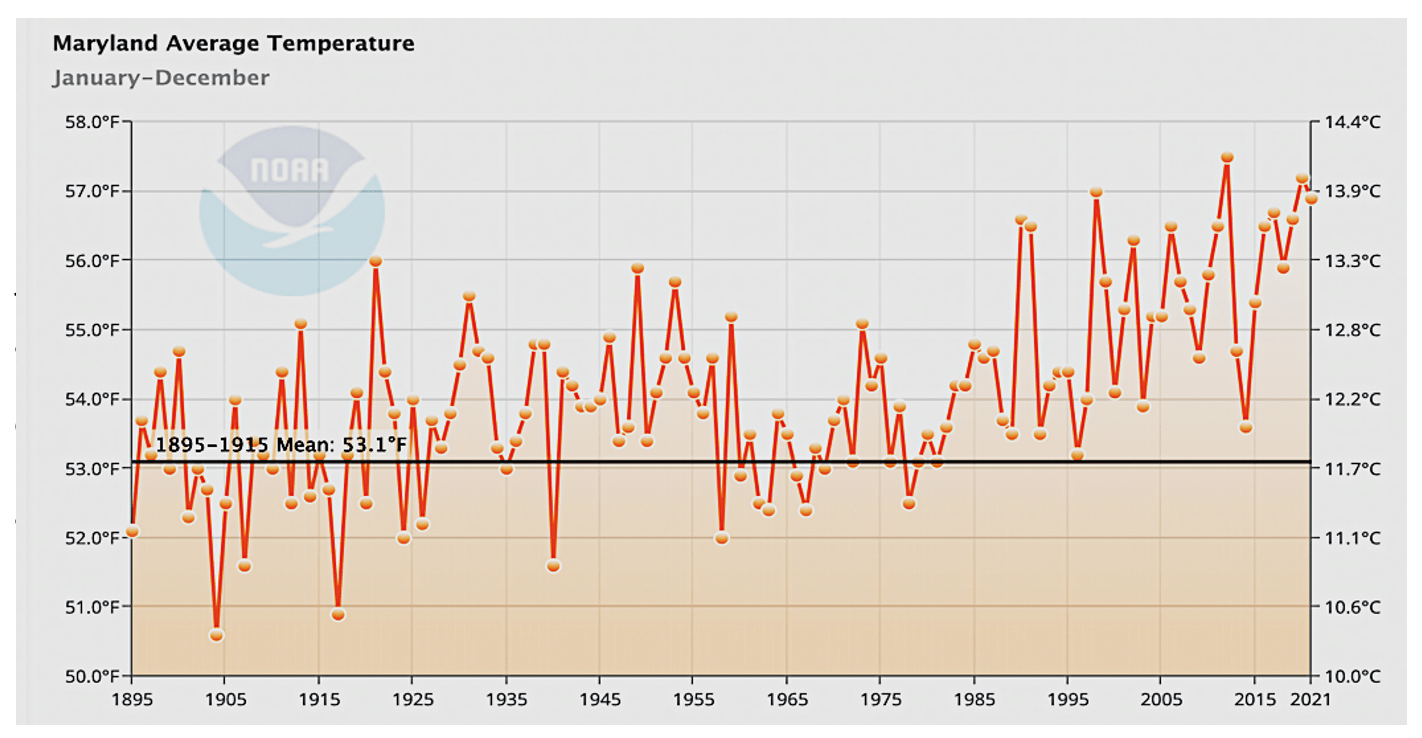
Maryland temperatures are clearly getting hotter overall. Our state’s average annual temperature has risen nearly 4°F (about 2°C) above the average between 1895-1915, which represents the pre-Industrial condition (Figure 1).
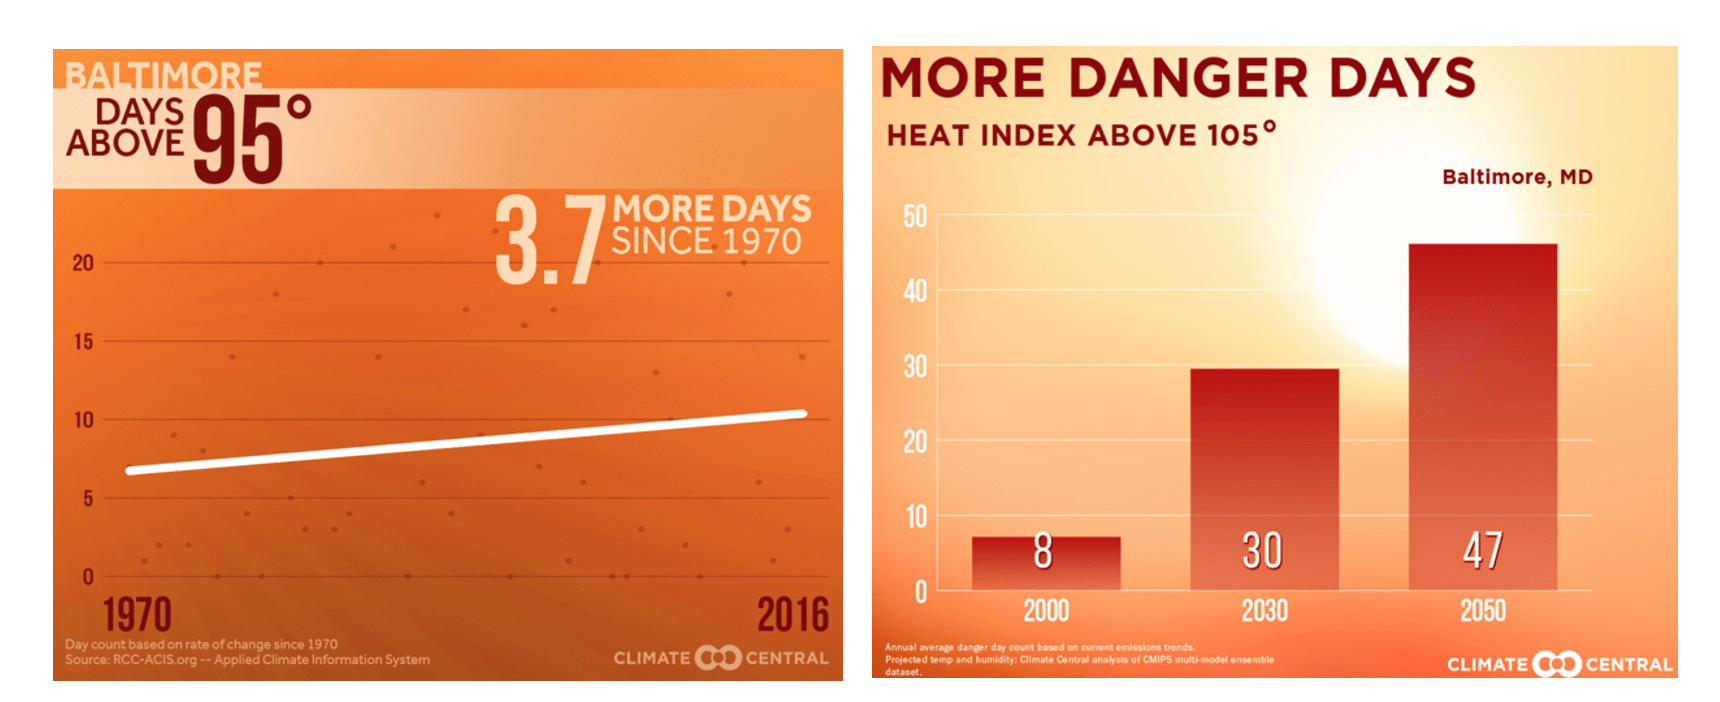
Both daytime and nighttime temperatures are getting hotter. From 1970-2016, the number of days each year over 95°F rose by 3.7 (Figure 2). This underestimates the current situation, given that that the hottest six years in human history have been 2015-2021. More worrisome for human health is the increase in the number of days with a heat index above 105°F since that reflects the reduced potential for evaporative cooling given the increase in humidity.
Figure 2. Left: Increase in the number of very hot days in Baltimore, 1970-2016. Right: Projected increases in the number of days in Baltimore with dangerous heat index values. From Climate Central’s Summer Heat Toolkit.
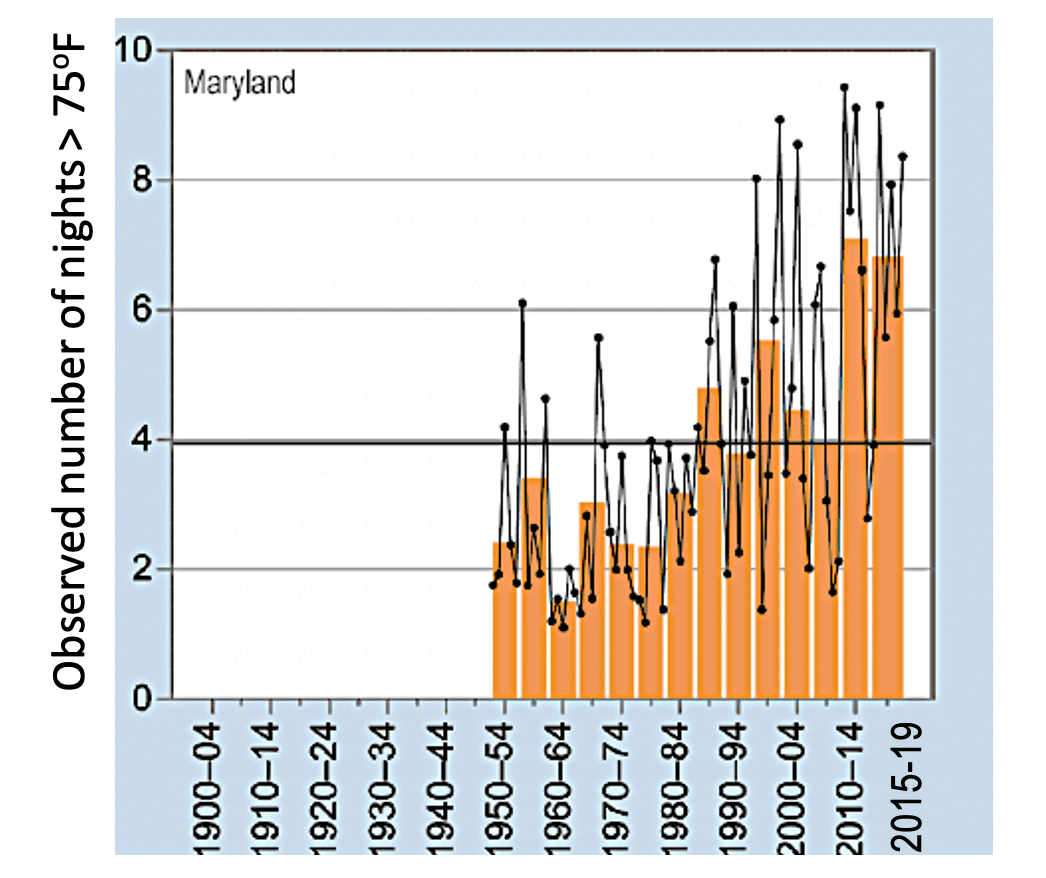
Nighttime temperatures are also rising in Maryland. The number of nights per year above 75°F was about 2 per year in 1950, rising to about 7 per year by 2019 (Figure 3).
Figure 3. More nights above 75oF than in 1950. Orange bars are 5-year state-wide averages, connected black dots are yearly averages. https://statesummaries.ncics.org/chapter/md/
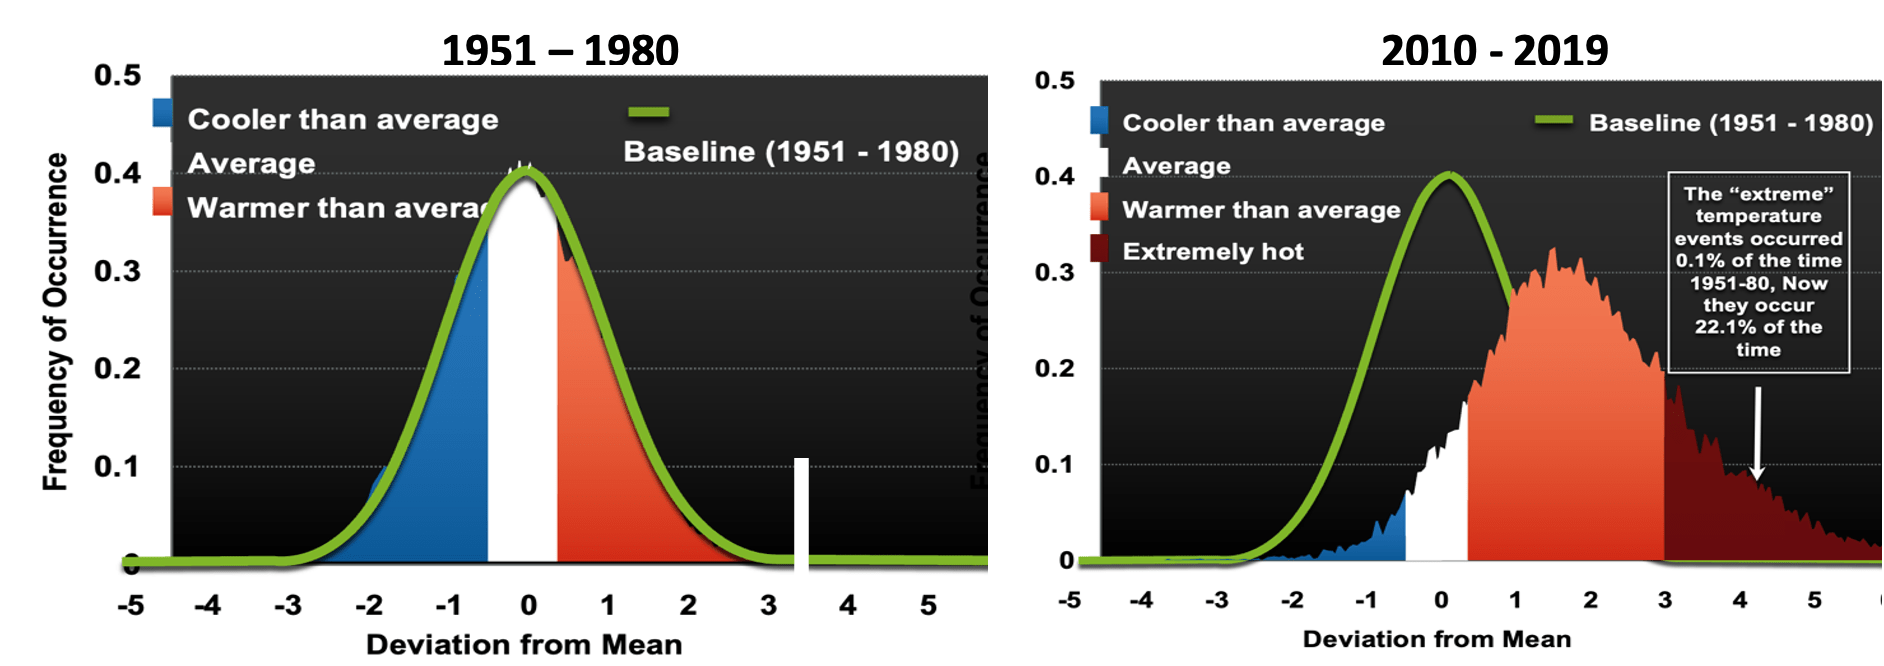
As temperatures increase, more heatwaves are expected.Between 1951–1980, extremely hot days occurred only 0.1% of the time (1 in 1000 days, white arrow in Figure 4, left). By 2019, those extremely hot days were occurring 22.1% of the time, a more than 200-fold increase in just 50 years (Figure 4, right). More extremely hot days increase the chances that several will occur in a row, making severe heatwaves more common than in the past.
Figure 4. Left: histogram of the observed average daily temperatures across the US from 1951 – 1980, centered around the mean. Right: average daily temperatures between 2010 – 2020 have shifted far to the right of the former distribution, so that many more days are now warmer than the 1951 – 1980 average. In fact, days hot enough to be seen only 0.01% of the time in the earlier interval were seen 22.1% of the time by 2019. Redrawn from Hansen & Sato 2020. http://redgreenandblue.org/2020/07/07/dr-james-hansen-regional-climate-change-national-responsibilities/.
Warming winters and longer growing seasons
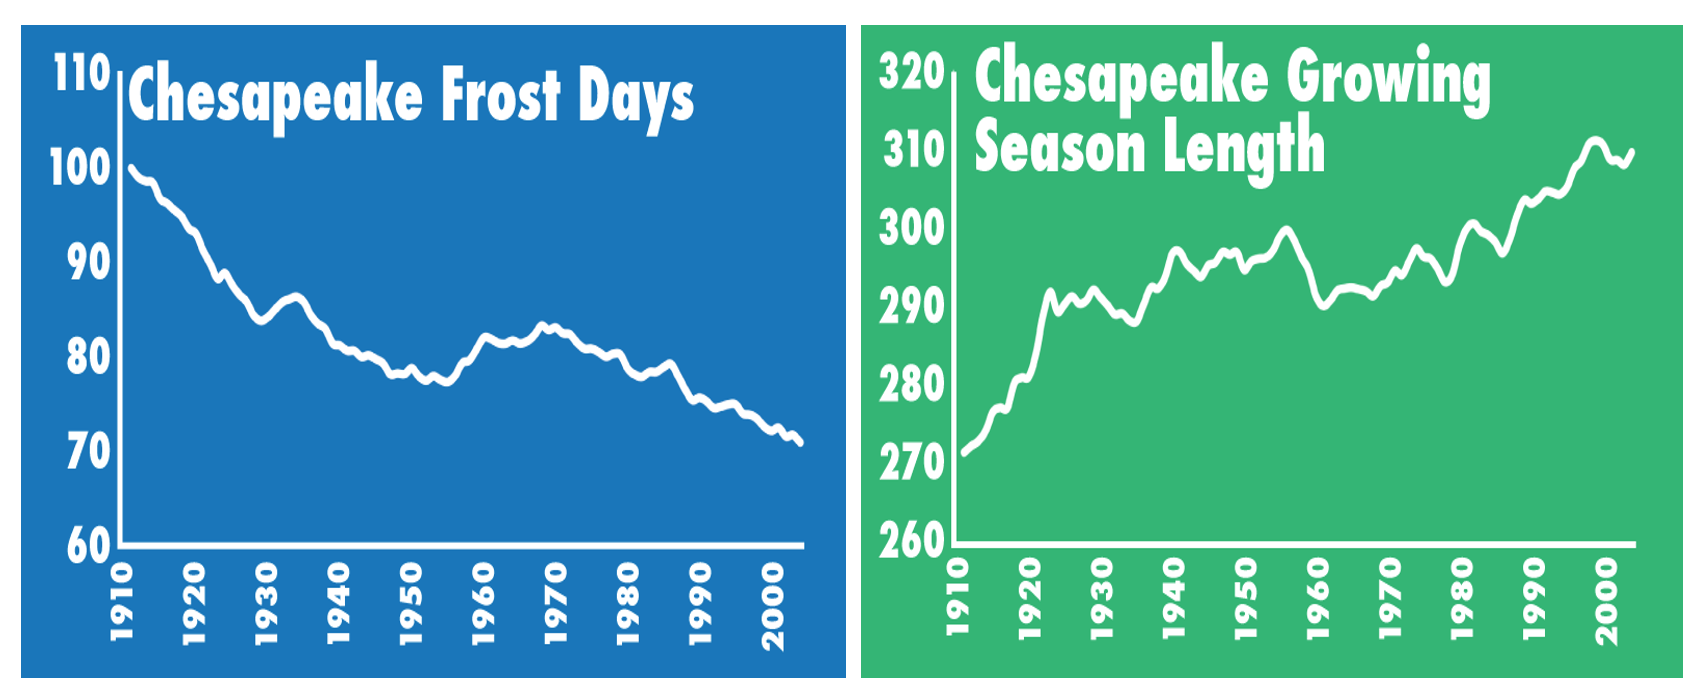
Compared with temperatures in 1910, Maryland now has about 30 fewer days with temperatures below freezing (Figure 5, left). Spring is coming earlier and fall is coming later, so the growing season is getting longer (Figure 5, right).
Figure 5. The Chesapeake region is warming, with fewer winter days below freezing. The last frost comes earlier and the first frost in the fall is later, lengthening the growing season. http://www.chesapeakedata.com/changingchesapeake/
Impacts of warmer winters: “false spring”. One of the consequences of warmer winters is the phenomenon called “false spring”, which occurs when the weather in February is particularly warm. Despite the trend toward warming winters, we are still likely to get a hard freeze sometime in March. If trees and perennials have broken dormancy in February, they are likely to suffer severe freeze damage.
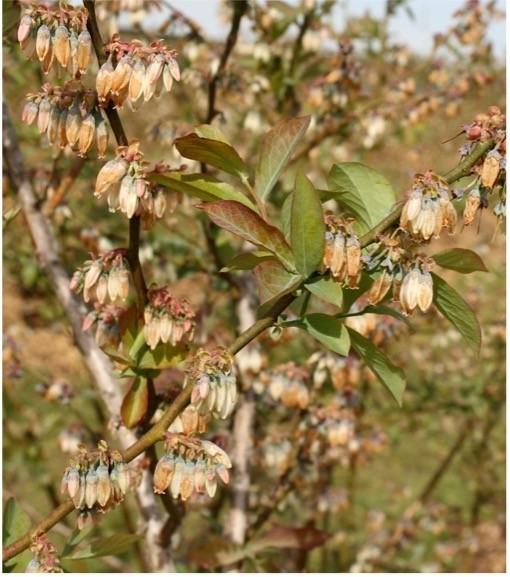
Maryland had a false spring in 2017. Many residential bulbs were blooming and flowering trees and fruit trees had broken dormancy. The hard freeze at this vulnerable stage killed flowers, eliminating the possibility of seeds and fruit for the year. Maryland peach growers barely managed to get a reduced crop. Had the freeze come just a few days earlier, the peach crop would have been destroyed. The 2017 false spring extended far south. In North Carolina, blueberry growers lost 100% of their crop (Figure 6) as did peach growers in Georgia.
For home gardeners, earlier springs can be a boon, allowing cool-season plants to be started earlier. However, the possibility of a late frost remains high, so it is wise to be ready to cover plants that have been put out before the advertised last frost date.
Impacts of warmer winters: Deer, insects, and other pests. More of the plants consumed by deer remain green through the winter, increasing the overwintering survival of adult deer and making successful reproduction more likely. Many more insect pests re also surviving the winter in Maryland or nearby states, increasing their abundance in spring. This means that in general you can expect insect pests to appear earlier in the summer and be more abundant.
Impacts of warmer winters: More overwintering weeds.Weeds are thriving in the warmer winter temperatures. Winter annuals grow abundantly, and weeds also germinate earlier than they did 50 or more years ago.
More severe storms and intense rainfall
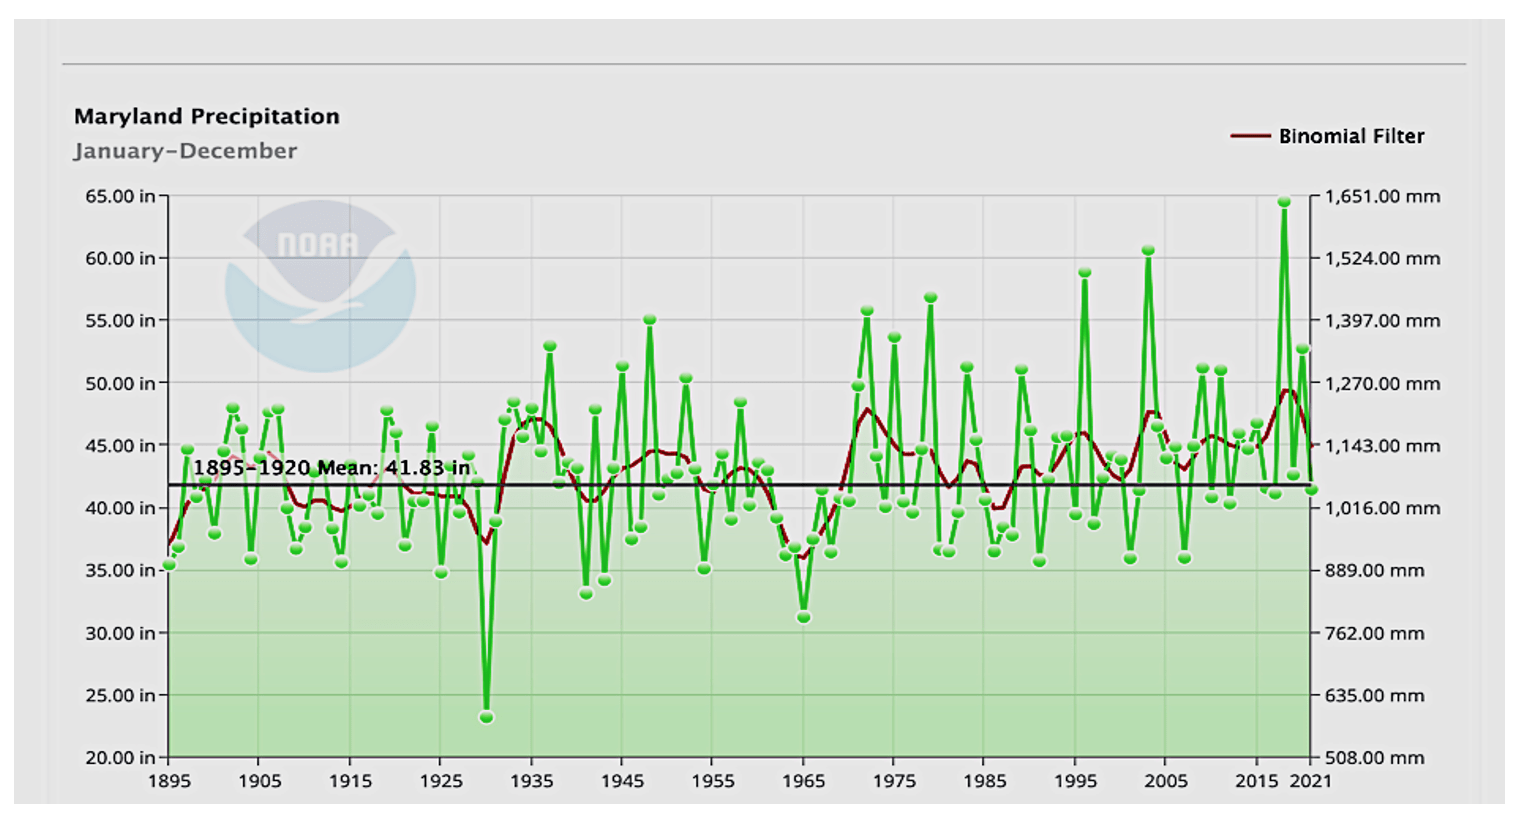
Annual rainfall is increasing in Maryland.Warm air holds more water vapor, giving the potential for increased rainfall, and this is what we are experiencing in Maryland (Figure 7).
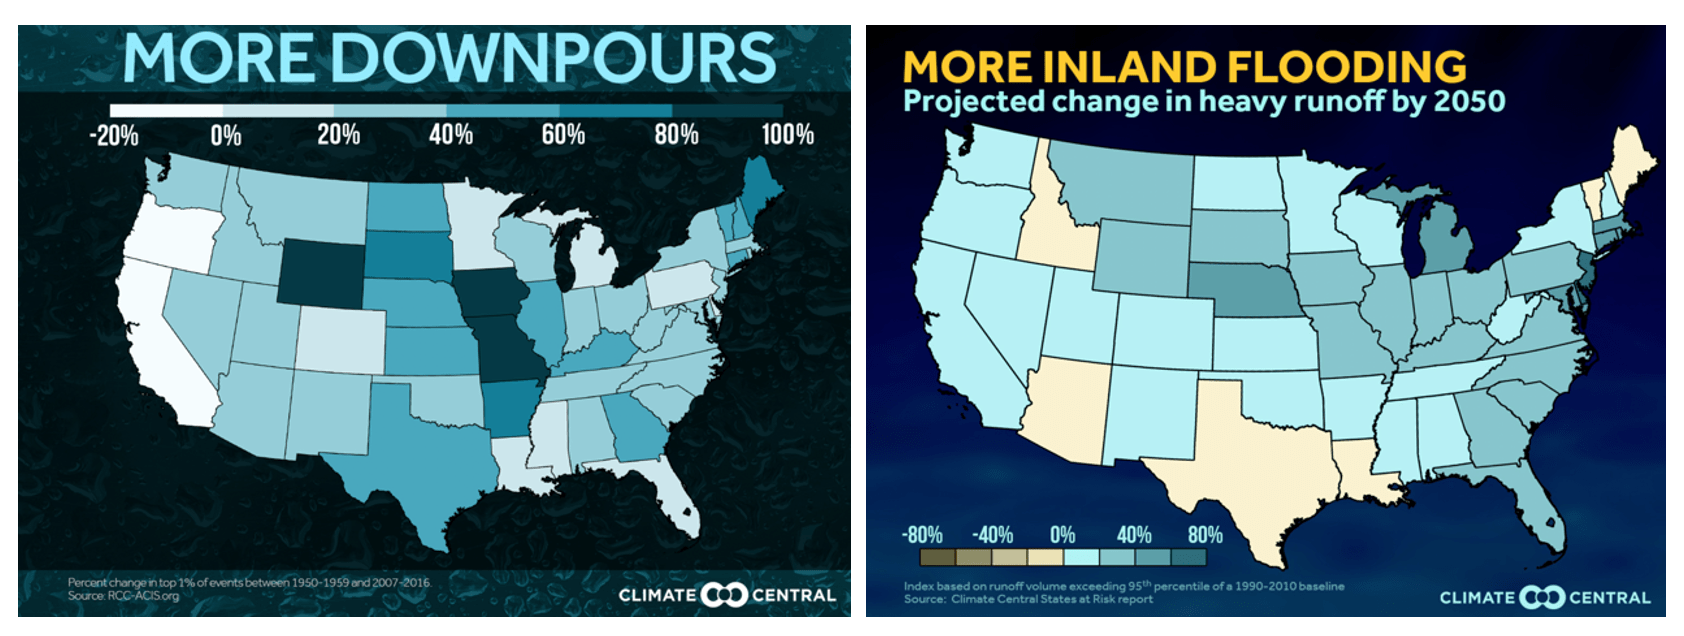
More intense rainfall and severe storms. Not only is there more rainfall, but more of our rain is now falling as downpours, which increases inland flooding (Figure 8). In Maryland, about 30% of rainstorms during the period 2007-2016 would have fallen into the top 1% of storm intensity had they occurred in the 1950s (Figure 8, left). This is at least in part due to the greater amount of water vapor now in the air (about 9% more than in 1950).
This heavy rainfall can cause flash flooding and tremendous soil erosion in regions where stormwater is not carefully managed. When rain falls very fast in a downpour, runoff commonly leads to inland flooding, which is projected to increase by about 50% in Maryland by 2050 (Figure 8, right). The catastrophic floods in Ellicott City in 2016 and 2018 illustrate the severity of inland flooding from more intense rainstorms.
Figure 8. Left: Many states across the US are experiencing more rain falling as downpours (left), with a corresponding projected increase in inland flooding from heavy runoff by 2050.
Finally, severe inland storms such as the derecho of 2013 are expected to become more common. Derechos occur when extremely hot air in the southern US collides with colder air in the north. The high winds that resulted from this collision caused wind speeds of 60-80 mph in the 2013 derecho; the storm moved 600 miles in just 10 hours.
The number of strong and damaging hurricanes is increasing.In 2017, just three hurricanes (Harvey, Irma, and Maria) caused over $295 billion in damage. The 2020 hurricane season broke records with 30 named storms, 12 of which made landfall. 2021 was the fourth-costliest hurricane season on record, with 21 named storms, including 7 that made landfall.
Although climate change is not increasing the number of tropical storms that arise, three changes make tropical storms more likely to become hurricanes that cause extensive damage to coastal areas.
Storms pick up more energy from the warming ocean. Tropical storms in the Atlantic gain energy from the increasingly warm ocean temperatures, and this energy translates into higher winds. When storm winds churn up cold ocean water, hurricanes decrease in energy and slow down. Now, coastal waters are warming down to several hundred feet. Very warm coastal waters partially explain why some recent hurricanes have shown unexpectedly rapid increases in strength as they approach the coast.
More water in the air means more rainfall. The extra water vapor now held in the warmer air results in more rainfall than was typical in the 1950s. Water is collected over a larger area than in the past, and larger, more intense storms are the result. In 2012, Hurricane Sandy’s winds circled all the way to the Midwest, drawing in enormous amounts of water that then fell as rain.
Winds that steer hurricanes away from the coast have slowed.In some recent hurricanes, the “steering currents” over land (winds that usually steer hurricanes away from the coast rather quickly) have been weaker than normal, causing the hurricane to stall near the site of landfall where it rains for several days. Examples of extraordinary rainfall from a stalled hurricane are the 50” that fell near Houston, TX from Hurricane Harvey in 2017, and the 30” dropped by Hurricane Florence in Wilmington, NC in 2018.
Sea level rise
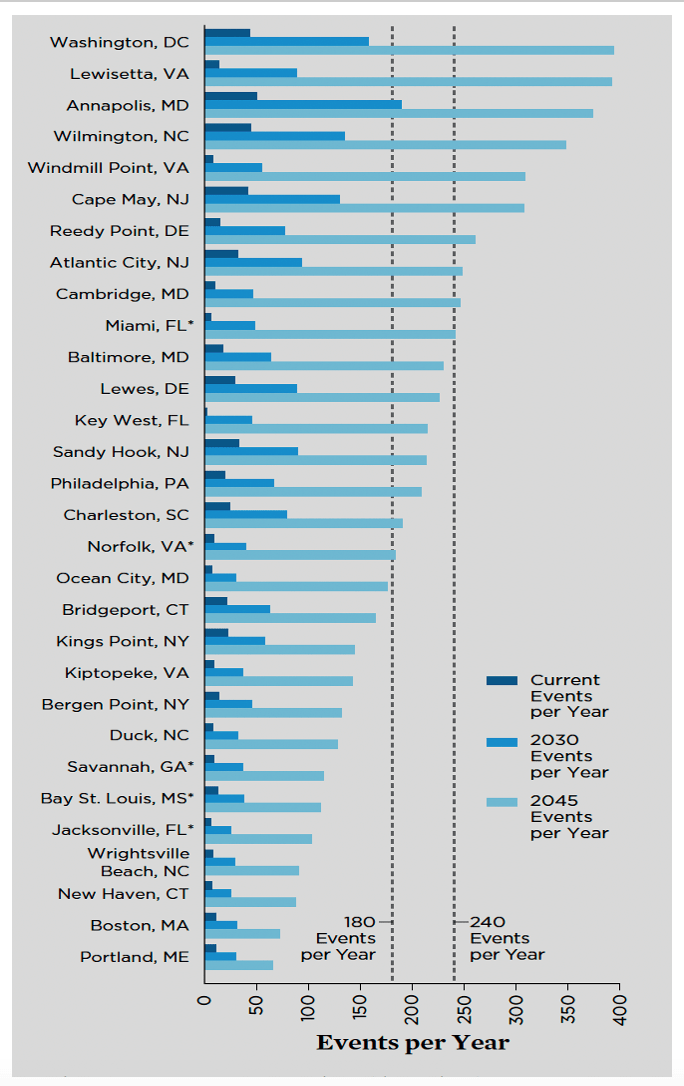
Figure 9. Number of tidal flooding events per year for cities along the East Coast (2014). Several cities in Maryland are among the most affected. From: https://www.ucsusa.org/resources/encroaching-tides
The Mid-Atlantic is particularly vulnerable to changing sea levels and is likely to see more rise than the global average. Given Maryland’s miles of coastline and the impact of rising season tidal flow in the Chesapeake Bay, communities on the Eastern Shore and the Bay are particularly subject to impacts from sea level rise.
Many cities in Maryland are among those experiencing more and more tidal flooding, that is, flooding that occurs during the highest tides of the month (Figure 9).
Storm surge
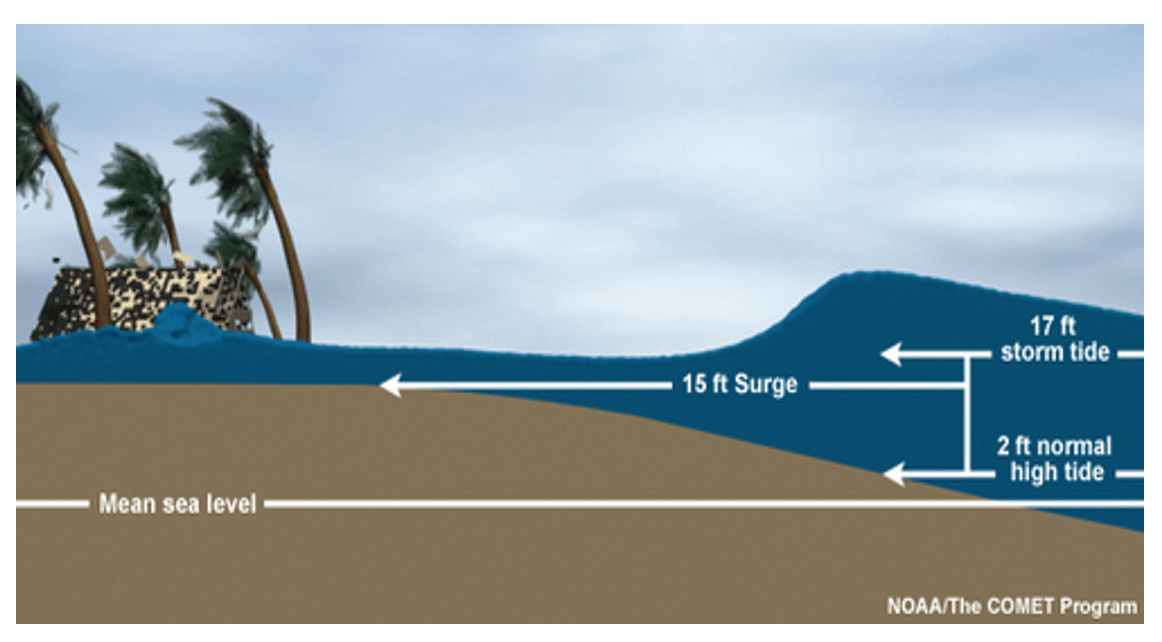
Increased sea level also makes storm surges during extreme weather on the coast much more serious, impacting not only coastal communities but also communities on the bay through increased tidal flux. Storm surge causes extensive flooding and damage to properties and is responsible for many injuries during severe storms.
Figure 10. Storm surge whipped up by a hurricane can be many feet higher than the normal high tide and come far inland. https://www.nhc.noaa.gov/surge/
Increasingly strange weather
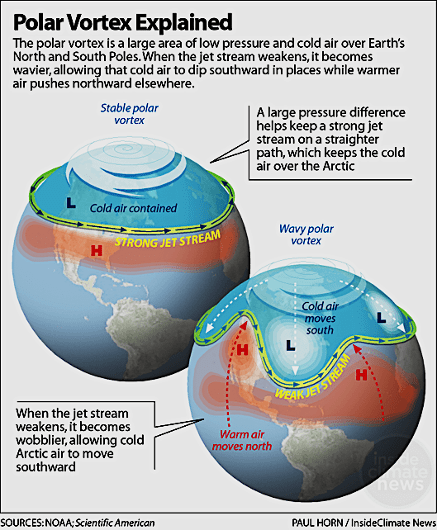
Climate change leads to not only an increase in the average air temperature over time but is associated with much greater variability in temperature. During the past few years in Maryland, it has become common to have temperatures fluctuate by 20-30 degrees within a single week. The extreme weather is not just limited to heat. Paradoxically, climate change is contributing to an increased probability of severely cold winters.
In 2014 and 2015, most of the central and eastern US had record cold temperatures, and half of the largest snowstorms on record in the region have occurred since 2003. This extreme winter cold is a likely byproduct of climate change. Rapidly warming temperatures in the Arctic and weaker circumpolar winds are increasingly allowing the jet stream to dip southward over North America east of the Rockies, bringing arctic air. This rapid flow of cold arctic air was partially responsible for the deadly freezing temperatures in Texas in 2021.
Human health impacts of climate change
Hotter summer weather is associated with many negative health outcomes. Heatstroke is more common on hot summer days, as are asthma attacks and cardiovascular events. Hotter nights make it difficult to sleep for those without air conditioning and are sometimes associated with increased urban violence. Hotter summers and colder winters (where they occur) can be deadly for low-income households where electricity bills consume a higher fraction of income than in middle-higher-income households.
Earlier springs and longer summers allow many insect species to produce additional generations in a year, while warmer winters increase their overwintering survival. This combination of longer summers and warmer winters is increasing the risk of Lyme disease in the Mid-Atlantic. First, the population size of the black-legged tick increases over the summer but is not reduced by cold winter weather. Warmer winters also provide more food and more benign conditions for overwintering deer and white-footed mice, the two major wild reservoirs of the Lyme disease bacterium, Borrelia bergdorferi.