The data are in and 99% of scientists agree. The climate is changing and causing increasingly negative impacts on the environment, weather, human health, and agriculture.
Scientists also agree that climate change is caused by the increasing atmospheric concentrations of a handful of so-called greenhouse gases (GHGs) and that human activities are the root of the problem.
The primary GHGs that cause climate change are carbon dioxide (CO₂), methane (CH₄), and nitrous oxide (N₂O).
Carbon dioxide is released by burning fossil fuels (coal, oil, and natural gas) for electricity and transportation.
Methane is 25 times as powerful a GHG as CO₂. It is emitted during digestion by ruminant animals, from the decomposition of organic material in landfills, from natural gas production, transport, and storage, and from melting permafrost.
Nitrous oxide is 300 times as potent as CO₂. The escalating emissions of N₂O currently trace primarily to the use of synthetic nitrogen fertilizer, but it is also emitted from manure storage and application.
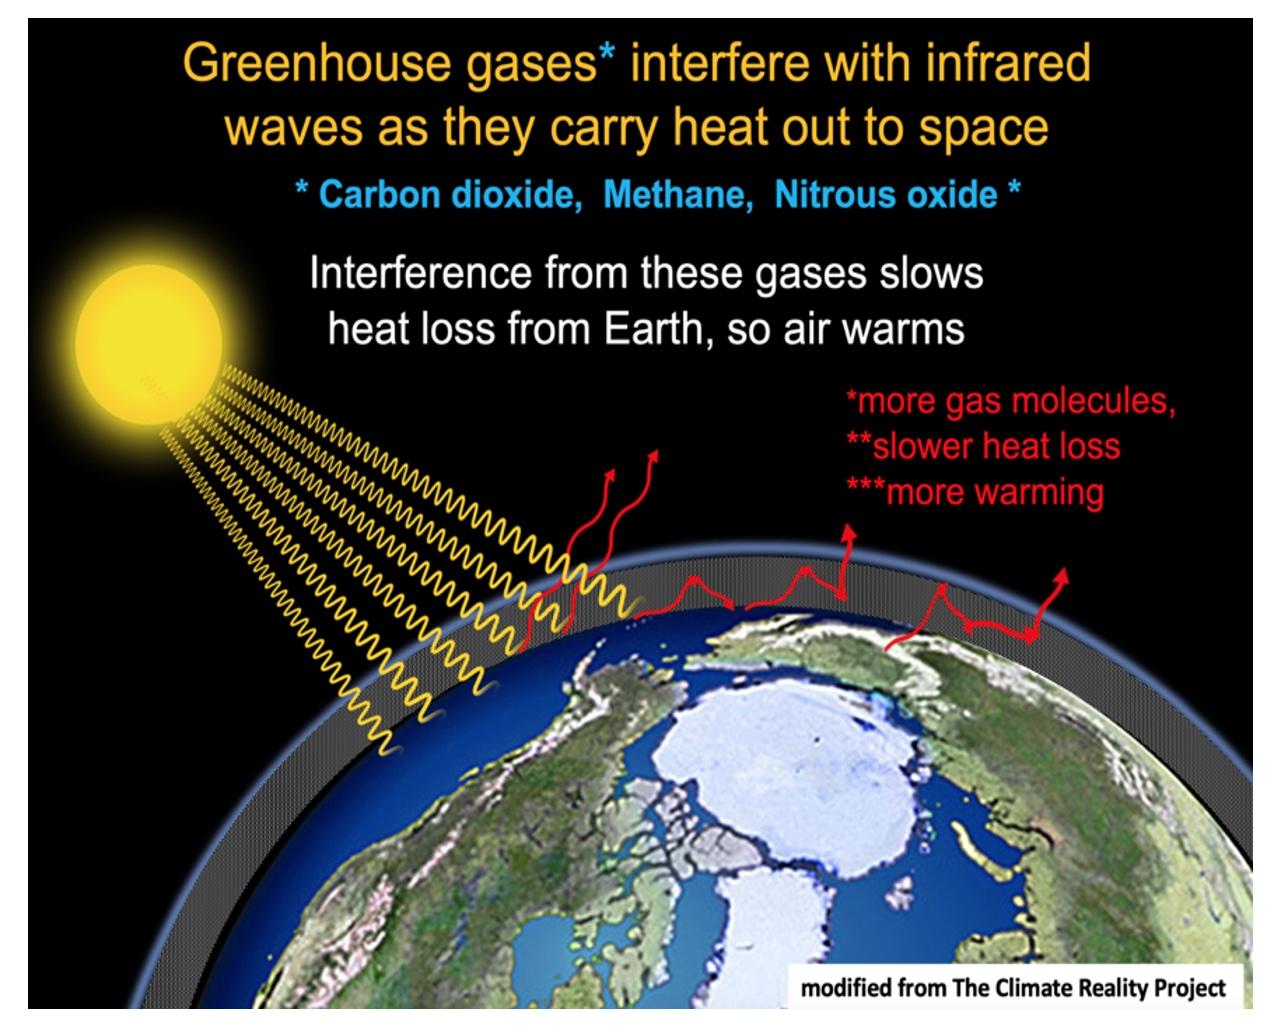
In the simplest terms, here’s how GHGs cause global warming. Every day the sun heats the Earth. In order for the average air temperature to remain roughly constant over time, an equal amount of heat must be transported out of the atmosphere back to space in the form of infrared (heat) waves radiated from the Earth’s surface (red arrows in Figure 1 below). Because of the particular chemical structure of the GHGs and the physical characteristics of infrared waves, a collision with a GHG molecule causes a heat wave to bounce off in a random direction rather than continuing in a direct path out into space. Increasing the atmospheric concentration of GHG molecules means that escaping heat waves experience more collisions and more bouncing around in the atmosphere before they can escape out into space. This delay in heat loss from Earth causes the atmospheric temperature to increase.
Figure 1. Illustration of how the greenhouse effect works. Source: The Climate Reality Project
It is essentially impossible to detect climate change through individual experience. In our daily lives, we experience weather, not climate. Weather is highly localized and varies on a short timescale of days or weeks, while climate is regional and varies gradually over decades. The difference between climate and weather is often described as “climate is what you expect, weather is what you get,” or “climate determines the clothing you keep in your closet, weather determines what you wear on a given day.” We can’t detect the small changes in climate that occur over decades because they are dwarfed by the shorter-term variability of weather.
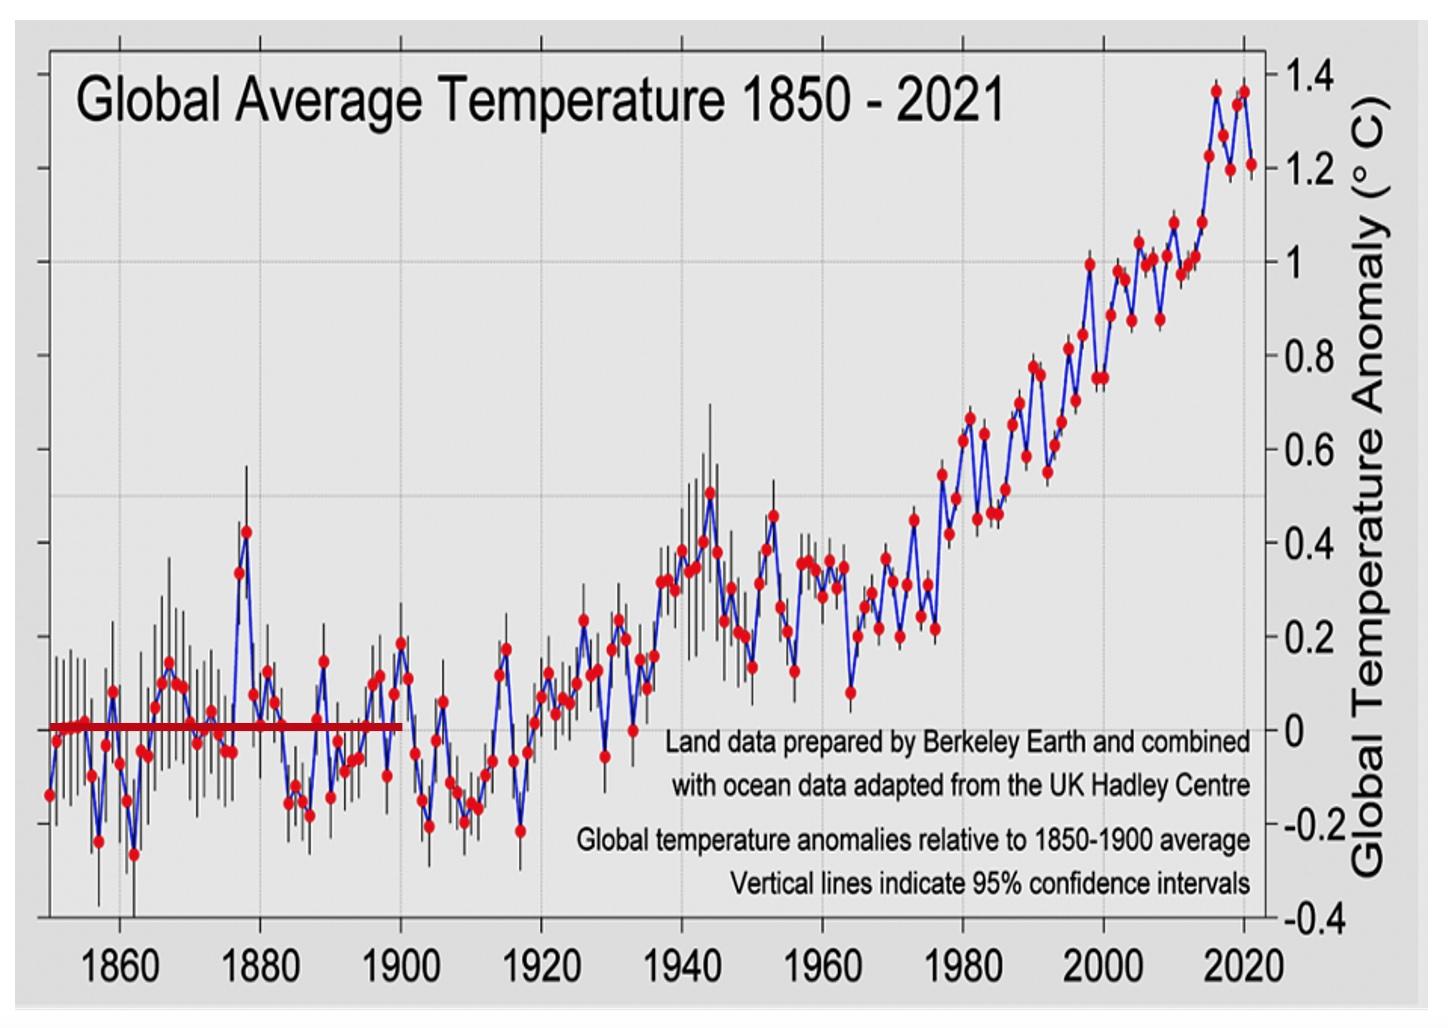
To clearly see evidence of climate change, we need to consult long-term records. Measures of global air and ocean temperatures across many years provide direct evidence of a long-term warming trend in global air temperatures. This trend can be seen clearly in records of the average global temperature from 1850-2021 (Figure 2). The fact that temperatures can vary dramatically from year-to-year does not contradict the clear long-term warming trend. Although it is tempting to think that a cooler than average summer or even a very cold winter might mean that global warming has slowed or stopped, such short-term variation in local weather is essentially just meaningless noise around the kind of long-term trend we see in Figure 2.
Figure 2. Long-term record of global average temperatures 1850-2021. Red dots are the yearly averages, vertical bars represent variation around that average. The solid red line marks the pre-Industrial average temperature, and the temperature anomaly is the difference between that yearly average and the pre-industrial baseline. Source: berkeleyearth.org/global-temperature-report-for-2021/
The solid red line in Figure 2 shows that the global average temperature was relatively constant from 1850 to 1900. This value is taken as a measure of the global average temperature in the pre-Industrial period. Increases in global temperature became visible in the 1920s, but the impact of human-caused climate change has become particularly stark since 1970.
Not only has each decade since 1970 been warmer than the last, but the past 7 years (2015-2021) also have been the hottest in all of human history, coming in at 1.2° – 1.4°C warmer than the pre-Industrial baseline.
The animation below is a visualization of the long-term global temperature data that also shows geographical variation in temperature each year. For the first 50 years or so, some locations are warmer than average, some are cooler. But beginning in about 1970, the directional warming impacts of human-caused climate change swamp the year-to-year and place-to-place variation in weather that dominated the picture before that time. The warming trend is clear.
ABOVE: Yearly observations of global temperatures since 1850. Source: BerkeleyEarth.org
In sum, the long-term data show that we are rapidly approaching a 1.5°C increase in global average temperatures, a threshold we must not exceed if we hope to avoid serious environmental and economic damage from climate change.
Why do we call this the greenhouse effect? Step inside a greenhouse on a hot summer day, and it will be hot! That’s because the glass slows the loss of heat from the greenhouse because it is not very permeable to infrared waves. Because the accumulation of GHGs in the atmosphere produces the same effect (though by a different mechanism), it became known as the greenhouse effect.
The greenhouse effect is nothing new. There have always been low levels of greenhouse gasses in the atmosphere that slowed the loss of heat from Earth. In fact, without the greenhouse effect, Earth would rapidly become too cold after dark to sustain life. But now, the exceptionally high concentrations of GHGs in the atmosphere have made the greenhouse effect a dangerous problem.
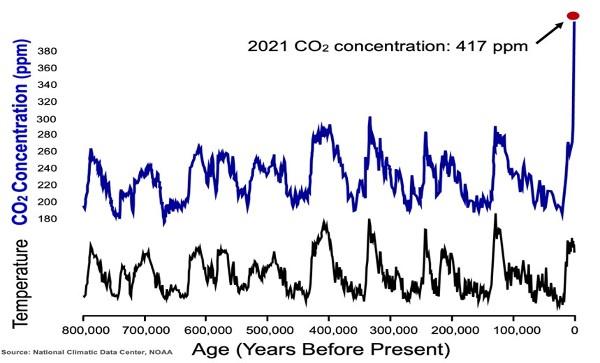
How do we know that the current level of warming is not just part of a natural cycle? Carbon dioxide concentrations in the atmosphere have oscillated between about 180-300 ppm over at least the last 800,000 years (Figure 3). We know this from measuring CO₂ concentrations in ice cores retrieved from thick deposits of Antarctic ice. These ice deposits formed from ancient snow that fell in Antarctica and became compressed over hundreds of thousands of years into ice. Scientists can date each section of an ice core the same way that fossils are dated, and tiny amounts of ancient air trapped in the ice can be extracted. The CO₂ concentration in that extracted air is a measure of the atmospheric CO₂ at the time that ice was formed. These measurements are the basis of an 800,000-year history of CO₂ concentrations in Antarctic air (see Fig. 3, blue trace). There are also ways to determine the temperature when a given section of ice core was formed, so that scientists can correlate atmospheric CO₂ with temperature over 800,000 years. This is a period of time that far exceeds human history on Earth.
Figure 3. Records of atmospheric CO₂ concentration (blue line) and air temperature (black line) for the past 800,000 years, obtained from ancient air trapped in Antarctic ice cores. The regular cycles are caused by regular changes in the tilt of the Earth. They cause the ice ages but are not involved in climate change. Note that over this long period of time, the maximum CO₂ concentration is 300ppm. In contrast, current levels are now nearly 420 ppm. This is so far out of the range of the previous cycles that it cannot be caused by the same process, consistent with the evidence presented below in Figures 4 & 5. Source: NOAA
How do we know humans are responsible? Two lines of evidence point to human activities as the primary cause of climate change.
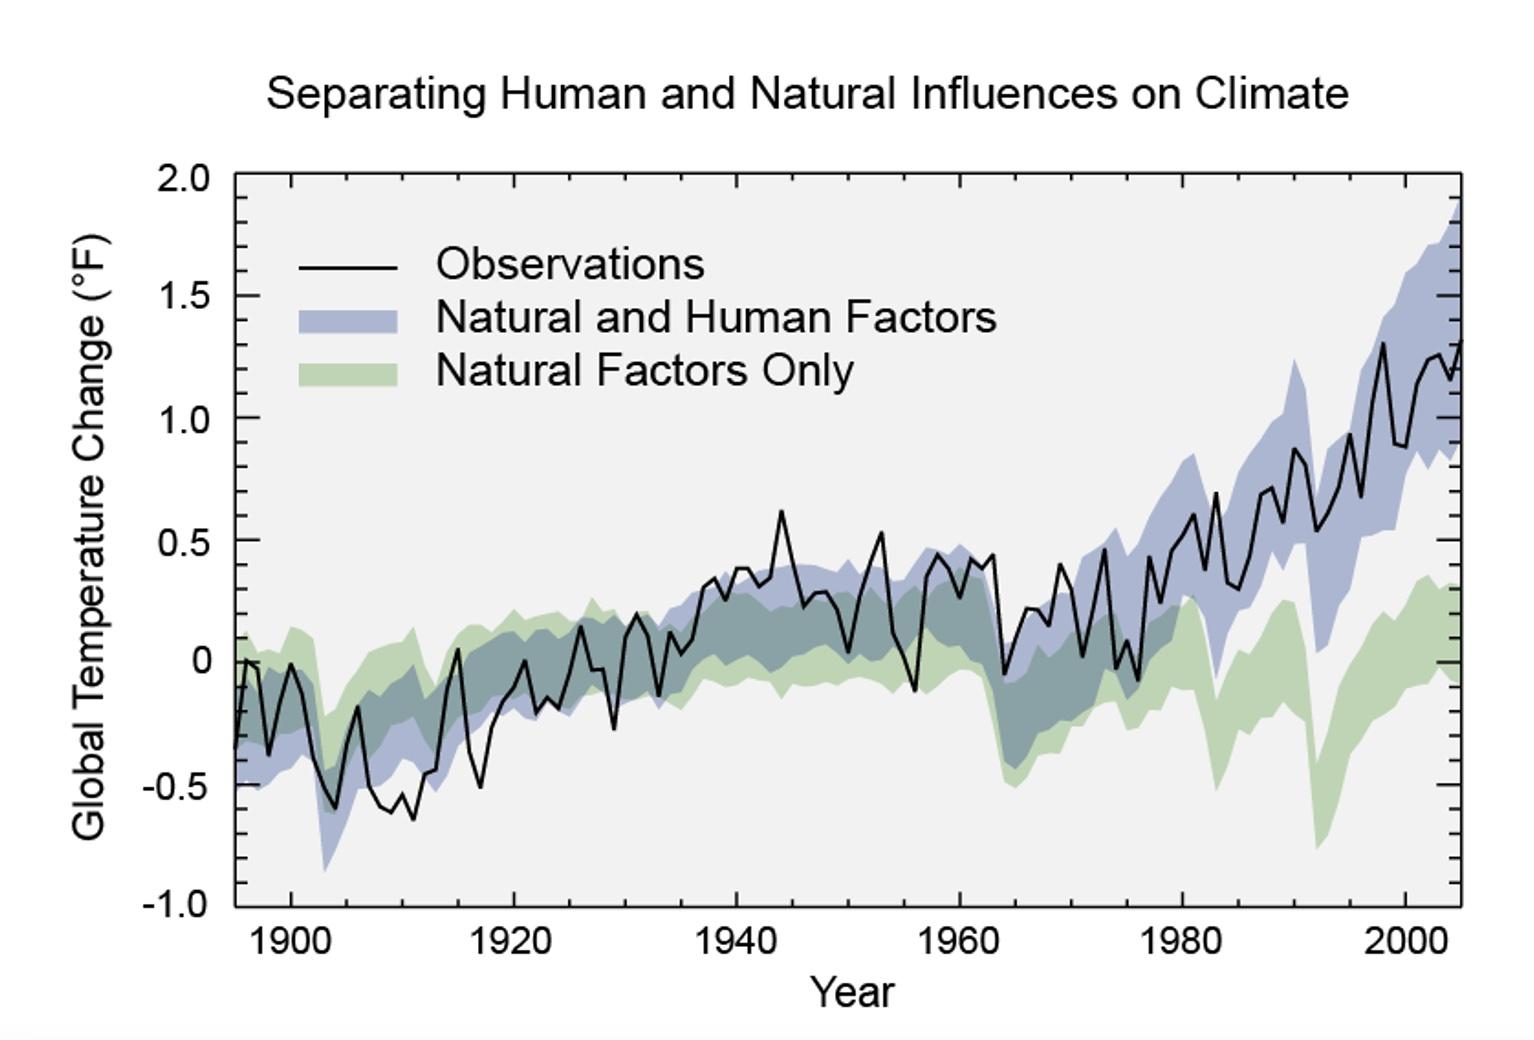
A. Natural factors alone cannot explain the observed rise in temperature. If we chart temperature changes since 1900 caused only by natural causes like volcanoes and solar activity, the temperature trend (Figure 4, blue line) does not correspond to the observed temperature increase (black line). Only by including temperature changes caused by the release of CO₂ into the atmosphere by humans produces results that match the observed data.
Figure 4. When comprehensive climate models are applied using historical data, we can ask which factors have affected the changes we’ve already seen. This is called “hindcasting”. When models are run using the entire array of natural and human factors that can drive climate change, we see a good correspondence to observed conditions (blue trajectory). This illustrates that the models have captured the key drivers of climate change. It also gives us confidence that model projections into the future will be meaningful. In contrast, when only natural climate drivers (solar activity, volcanos and changes in the Earth’s orbit) are included in climate models, the rise in global temperature seen in the long-term data (black line) is not captured (green trajectory).
If you are interested in examining the impacts of individual natural or human factors on global temperature, consult the excellent interactive version of Figure 4 using this link: https://nca2018.globalchange.gov/chapter/2#fig-2-1
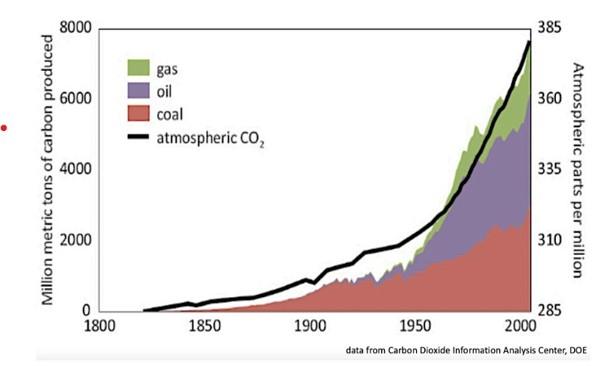
B. The total amount of CO₂ emitted by fossil fuels since the Industrial Revolution closely matches the observed increase in atmospheric CO₂ (black line in Figure 5).This tight association between the carbon emitted from burning fossil fuels and measured increases in atmospheric CO₂ is the human fingerprint of climate change.
Figure 5. Records of the cumulative carbon emissions from burning fossil fuels (natural gas, oil, and coal), closely match the observed increase in atmospheric CO₂. This is clear evidence of the human impact on climate change. Source: Carbon Dioxide Information Analysis Center, DOE
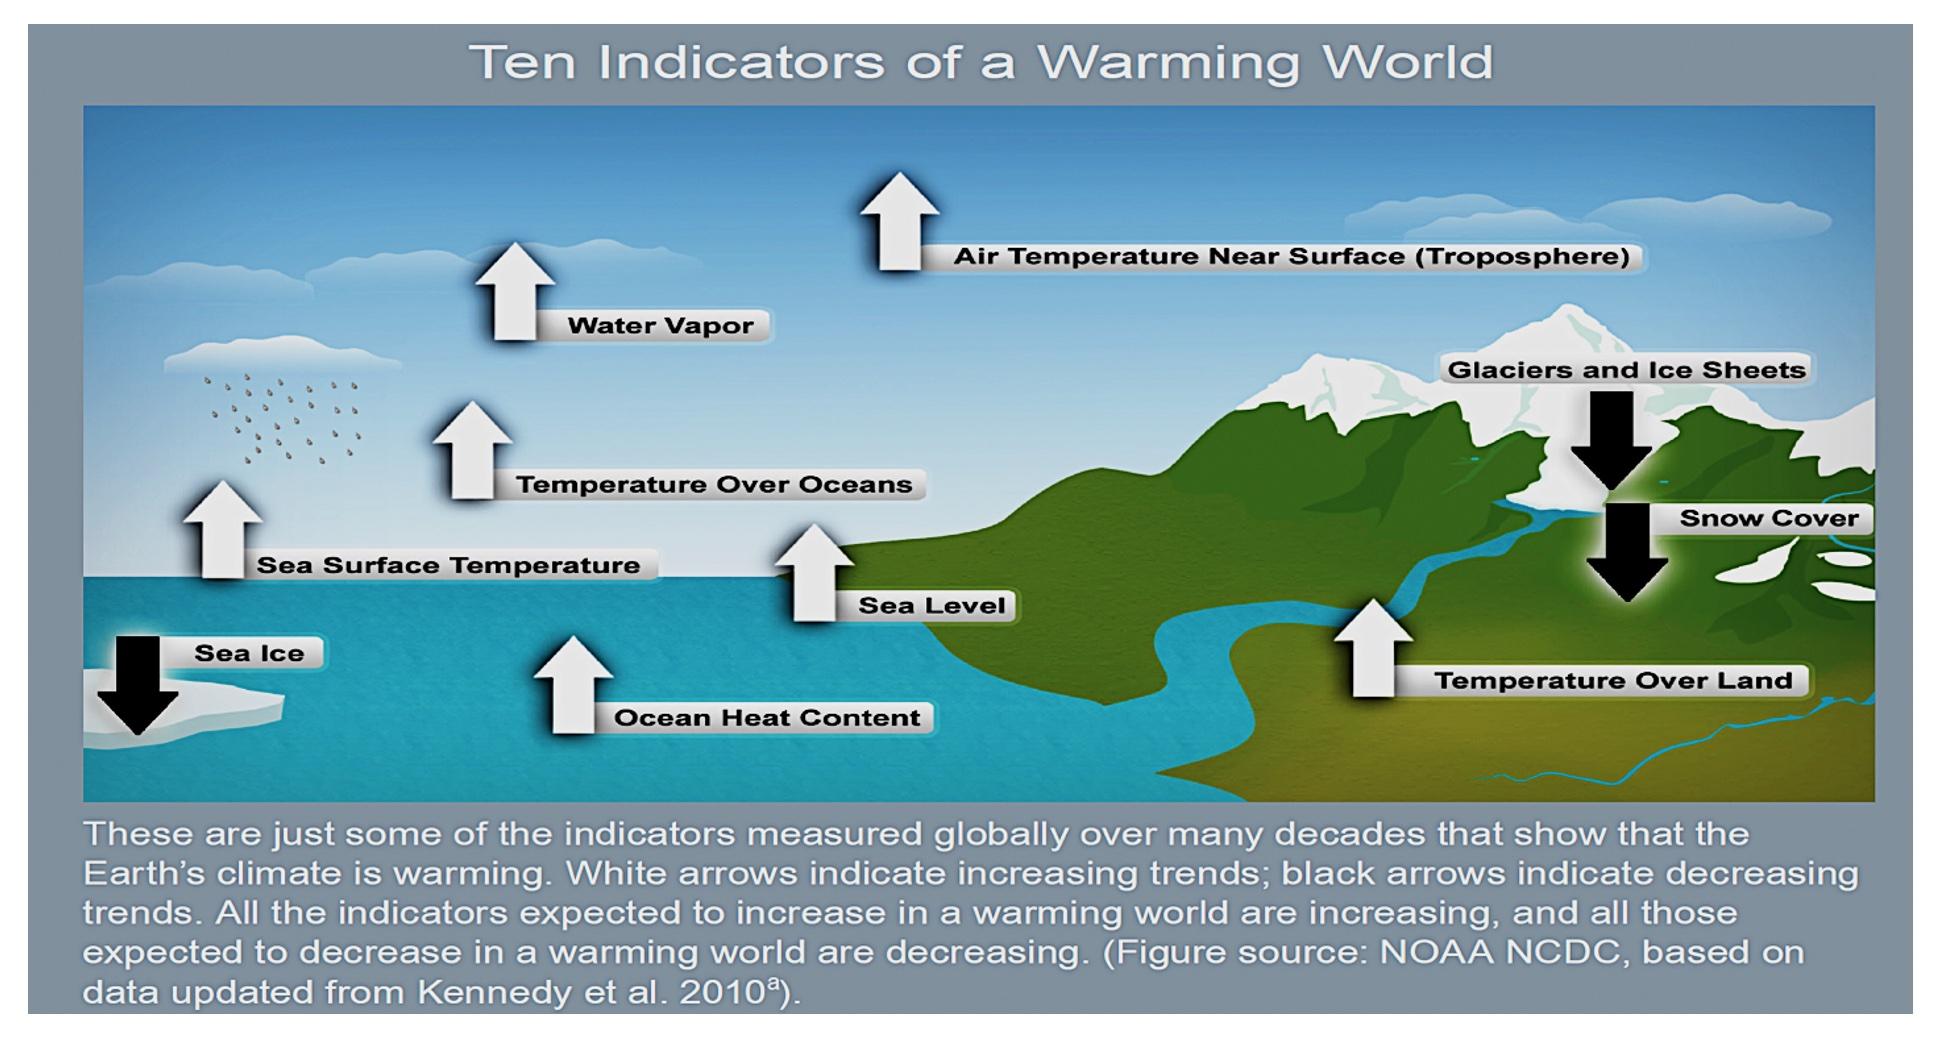
Why do we call this climate change instead of global warming? Warmer air in the atmosphere has triggered a complex set of changes on Earth that reflect the impact of increasing atmospheric concentrations of GHGs (Figure 6).
Figure 6. Ten Indicators of a Warming World. Source: NOAA
Most of the extra heat generated by the greenhouse effect doesn’t remain in the atmosphere. Instead, over 93% of it is absorbed by the world’s oceans, with numerous impacts:
Warmer oceans take up more space, contributing to sea-level rise along with meltwater from land-based glaciers such as the Greenland ice sheet. Melting ice that is already in the ocean doesn’t increase sea level, though this loss of ice darkens the surface of the ocean, accelerating the rise in ocean temperature.
This increased humidity means that hot summer temperatures feel even hotter and are more dangerous because a rising heat index means that our bodies can’t cool by evaporating sweat as readily as before.
The Arctic regions have warmed more than the equator, so the difference in temperature between these two regions has declined. Because winds (and currents) are generated by differences in air (or ocean) temperature between regions, we are seeing alterations in patterns of prevailing winds and ocean currents.
What will the future look like? We’re at CODE Red now. In August 2021, the Intergovernmental Panel on Climate Change (IPCC) released an updated report on the state of the global climate. Given that this document required agreement from all participating countries, the conclusions can be taken as conservative. Despite this basic conservatism, the data reveals that climate change is now so advanced that the UN Secretary-General pronounced the results of the report as a “CODE Red for Humanity.”
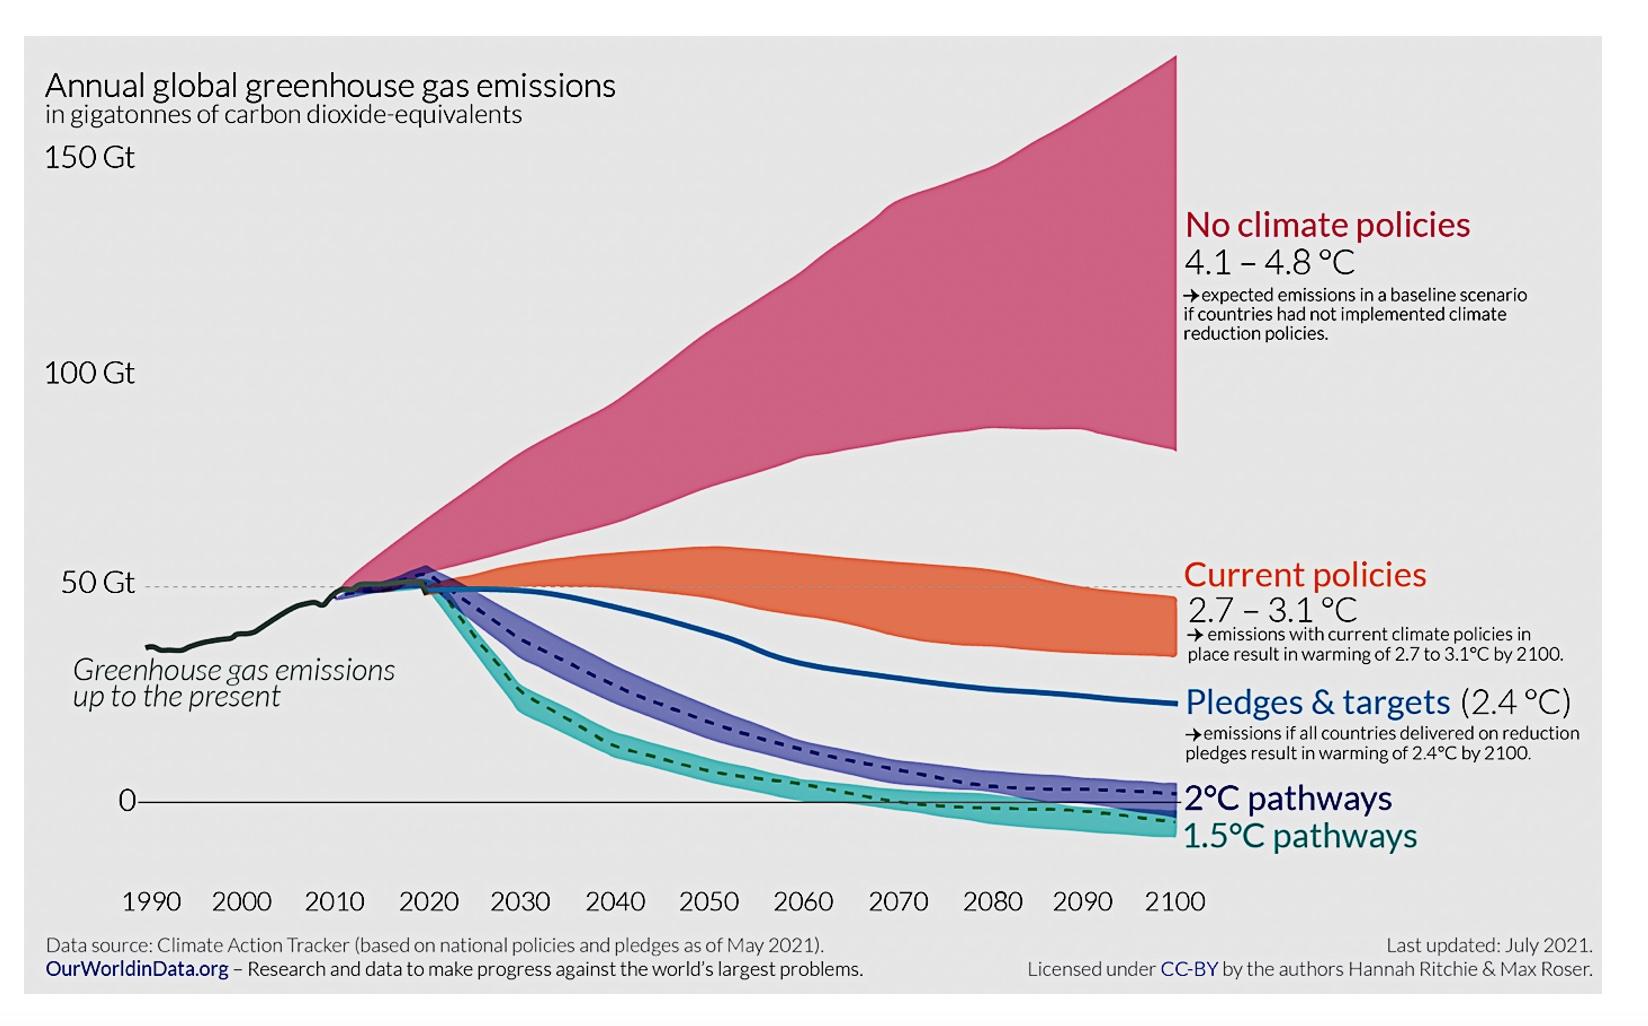
This report makes it all too clear that rapid and significant climate action is required in order to avoid catastrophic climate impacts during this century. We can still hold global temperature increase to 1.5 – 2ᵒC if we reduce GHG emissions rapidly and dramatically (Figure 7).
Figure 7. Observed GHG emissions from human activities and projected global temperatures under different scenarios of future action by the world’s nations. Each trajectory involves some uncertainty as indicated by the shaded areas. “Current Policies” represent global changes made since the Paris Agreement, while “Pledges and targets” represent the remainder of the promised emissions reductions under the Paris Accord. Despite progress, these pledges are not yet enough. To limit the global temperature increase to 1.5 – 2.0oC, nations will need to immediately begin very sharp reductions in GHG emissions from transportation, electricity generation, manufacturing, agriculture, and other economic sectors.
USGCRP, 2018: Impacts, Risks, and Adaptation in the United States: Fourth National Climate Assessment, Volume II [Reidmiller, D.R., C.W. Avery, D.R. Easterling, K.E. Kunkel, K.L.M. Lewis, T.K. Maycock, and B.C. Stewart (eds.)]. U.S. Global Change Research Program, Washington, DC, USA, 1515 pp. doi: 10.7930/NCA4.2018. https://nca2018.globalchange.gov/.