

FS-2025-0798 | August 2026
A 2024 Needs Assessment of the Shellfish Aquaculture Industry in Maryland
By Matt Parker & Don Webster, University of Maryland Extension and Allen Pattillo, University of Maryland
Clark School of Engineering
Introduction
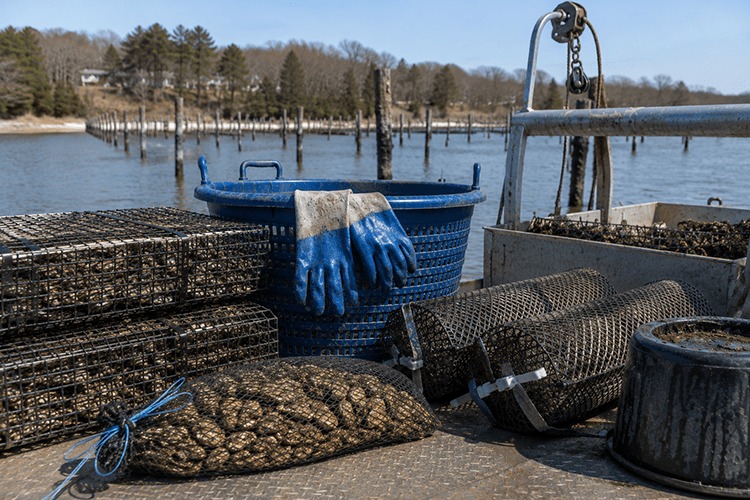
To support the development of targeted educational programming for Maryland’s shellfish aquaculture industry, researchers at the University of Maryland Extension (UME) conducted a comprehensive Needs Assessment in 2024. The last such assessment had been carried out a decade earlier in 2014 (Lazur, 2014) by the Maryland Aquaculture Coordinating Council (ACC). Both surveys solicited information from individuals holding Maryland aquaculture permits, ensuring that responses came from people who were actively involved in the Maryland shellfish aquaculture industry. A comparison of the data provides a robust picture of the evolving challenges and opportunities facing Maryland shellfish aquaculture today. These and other survey findings will guide how UME focuses resources on business and production support and may in turn help local regulatory agencies understand the current challenges facing members of the industry.
Methods
For the 2024 survey, researchers adapted the 2014 ACC Needs Assessment, using it as a foundation and preserving the phrasing and formatting of the original questions whenever possible. They incorporated some additional questions based on input from UME Aquaculture Specialists and included several new demographic questions. The University of Maryland Institutional Review Board (IRB) approved the survey (IRB# 2140715-1), which was then emailed to Maryland aquaculture permit or lease holders using addresses provided by the Maryland Department of Natural Resources (DNR). Unlike the 2014 assessment, which relied exclusively on paper surveys that had to be submitted by mail, the 2024 version was conducted electronically through Qualtrics, with follow-up emails used to encourage participation.
Survey Participation and Demographics
The 2024 survey received 63 responses, with 97% of respondents answering all questions. There are an estimated 150 shellfish farms in Maryland. Overall survey response rate is estimated at 42%. Of these, almost all provided demographic data. Compared to 2014, when 112 individuals responded (55.3% survey completion), the 2024 survey had a lower absolute number of respondents but a higher completion rate among those contacted.
The demographic profile of the industry in 2024 shows that it remains predominantly male (89%) and White or Caucasian (88%). The age distribution shifted slightly, with 34% of respondents aged 35–44 and 30% over age 65, suggesting both a strong midcareer presence and an aging workforce. Educational attainment is high: 45% of respondents in 2024 held a graduate or professional degree, compared to no specific education data reported in 2014. Specific demographic characteristics of survey respondents are shown in Table 1.
Table 1. Optional demographics from survey respondents. Sums may not equal 100% due to rounding.
| Response | Percentage (%) | Count |
|---|---|---|
| Yes | 93% | 55 |
| Age Group | Percentage (%) | Count |
|---|---|---|
| 25-34 years old | 2% | 1 |
| 35-44 years old | 34% | 17 |
| 45-54 years old | 16% | 8 |
| 55-64 years old | 18% | 9 |
| 65+ years old | 30% | 15 |
| Gender Identity | Percentage (%) | Count |
|---|---|---|
| Male | 89% | 48 |
| Female | 7% | 4 |
| Prefer not to say | 4% | 2 |
| Non-binary / third gender / Prefer to self-describe | 0% | 0 |
| Response | Percentage (%) | Count |
|---|---|---|
| Yes | 0% | 0 |
| No | 100% | 48 |
| Race | Percentage (%) | Count |
|---|---|---|
| White or Caucasian | 88% | 44 |
| Asian | 40% | 2 |
| American Indian/Native American or Alaska Native | 2% | 1 |
| Other | 2% | 1 |
| Prefer not to say | 2% | 2 |
| Black or African American / Native Hawaiian or Other Pacific Islander | 0% | 0 |
| Response | Percentage (%) | Count |
|---|---|---|
| Live in Maryland | 91% | 53 |
| Do not live in Maryland | 9% | 5 |
| Education | Percentage (%) | Count |
|---|---|---|
| Graduate or professional degree (MA, MS, MBA, PhD, JD, MD, DDS etc.) | 45% | 22 |
| Bachelor’s degree | 27% | 13 |
| Some college, but no degree | 14% | 7 |
| High school diploma or GED | 12% | 6 |
| Associates or technical degree | 2% | 1 |
| Some high school or less / Prefer not to say | 0% | 0 |
Business and Operations: Growth Trends
In 2024, 89% of respondents owned or operated an aquaculture business in Maryland, up from 76% in 2014. A notable shift occurred in industry professionalization: 45% identified aquaculture as their primary occupation in 2024, more than double the 19% reported in 2014. Full-time commitment also rose sharply - from 15% in 2014 to 41% in 2024 - indicating industry maturation.
Experience-wise, in 2014, 33% had been in business for over 20 years, whereas in 2024, only 8% reported such tenure. Instead, the majority had been in operation for 6–20 years, suggesting a wave of establishment and growth over the last decade.
Species Specialization
Oysters remain the dominant species cultured, with 85% of 2024 respondents reporting oyster production, up from 75% in 2014. Other species, such as clams, remained a minor component (5% in 2024). Nonshellfish species like bass and tilapia, which appeared in 2014 (11%), were no longer reported in 2024.
Consistent Locations
St. Mary’s County remains the hub of aquaculture activity, increasing its share of respondents from 18% in 2014 to 28% in 2024. Worcester, Dorchester, and Talbot counties also continue to represent significant activity centers.
Marketing Channels
Marketing strategies in 2024 were more diversified. While wholesale (21%) and live sales (19%) were still prominent, newer strategies such as online sales (8%) and onsite retail (7%) emerged. This marks a shift from 2014, where wholesale and live sales dominated (36% and 32%, respectively).
Water Access
Water access in 2024 showed reduced reliance on owned waterfront property (39%) compared to 2014 (48%). Instead, more respondents used marinas (18%) or private docks (24%), suggesting adaptive solutions to counter access challenges.
Critical Challenges
Site Selection and Regulatory Issues: Persistent and Worsening Trends
Securing permits and leases became even more challenging in 2024, with 74% rating it as a major concern, up from 35% in 2014. Difficulty also worsened in locating suitable sites (47% in 2024 vs. 34% in 2014) and knowing where to site operations (43% in 2024 vs. 37% in 2014). Additionally, respondents reporting at least 1 conflict with other users more than doubled, rising from 12% in 2014 to 30% in 2024.
Business and Financial Issues: Emergent Concerns about Cost and Labor
The cost of shell/substrate emerged as a new concern in 2024, with more than 40% of respondents reporting that it affected them “a lot.” Access to markets also grew as a challenge (40% in 2024 vs. 16% in 2014). While the availability of financing remained stable (22%), labor issues (availability at 36% and cost at 33%) became notable new concerns.
Production and Handling Issues: New and Continuing Challenges
Consistent concerns from 2014 to 2024 include seed supply (28% in 2024 vs. 27% in 2014) and disease (23% in 2024 vs. 18% in 2014). However, new technological challenges arose, particularly the availability of efficient harvest technology (26% in 2024 vs. 8% in 2014). Access to processing facilities also became more critical (23% in 2024 vs. 7% in 2014). Key changes and insights between 2014 and 2024 are presented in Table 2.
| Category | 2014 | 2024 | Change / Key Insight |
|---|---|---|---|
| Years in Business | 33% over 20 yrs; 35% under 5 yrs | 8% over 20 yrs; 33% under 5 yrs | Fewer veterans, more mid-career/new operators |
| Own/Operate Aquaculture Business | 76% | 89% | Increase in business ownership |
| Shellfish Leaseholders | 69% | 89% | More leaseholders, stronger industry identity |
| Aquaculture as Primary Occupation | 19% | 45% | More full-time professionals in the field |
| Full-Time Operators | 15% | 41% | Nearly tripled since 2014 |
| Oyster Producers | 75% | 86% | Oysters remain dominant, increased share |
| Own Waterfront Property | 48% | 40% | Fewer owners; more shared or marina access |
| Permit/Lease = Major Concern | 35% | 74% | Most pressing and growing issue |
| Access to Markets | 16% | 40% | Nearly tripled concern |
| Availability of Labor | Not measured | 36% | N/A |
| Harvest Technology | 8% | 26% | Rising concern with mechanization needs |
| Access to Processing Facilities | 7% | 23% | Became a critical issue |
Key Concerns Over the Next 5–10 Years
Respondents identified their top concerns through open-ended responses. The highest frequency concerns were Access & Lease, Regulatory issues, and Market Challenges—each cited as top-three priorities by 23 respondents. Biological issues, labor, infrastructure, environmental concerns, and financial constraints followed. Below are selected quotes (edited for spelling and grammar) reflecting what some survey respondents felt were the biggest challenges to their businesses in the next 5-10 years:
- “It is hard to get bottom building materials and also the application process for getting import permits and lease app is super long.”
- “My age, I’m 72, and how much longer will I be physically able to work the lease?”
- “The ability to scale with current labor and tech constraints.”
- “Quality leases in an area with natural recruitment and little opposition. The speed at which it takes to obtain a lease. “
- “The cost of shell and larvae.”
Educational and Extension Priorities
2024.
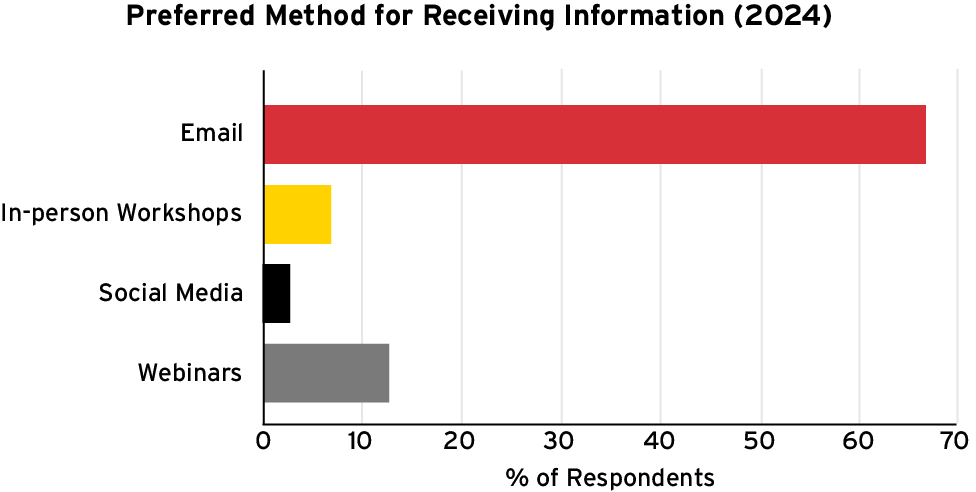
When asked how they preferred to receive information, two-thirds of 2024 respondents favored email. Webinars were next (13%), while traditional in-person workshops were of minimal interest (7%) (Figure 1). This marks a shift from 2014, when workshops and in-person engagement were more standard, and follows similar national trends post-Covid, as virtual meetings have become the new normal (Richter et al, 2021). The authors acknowledge that this preference may also be confounded by the survey being solely conducted via online tools.
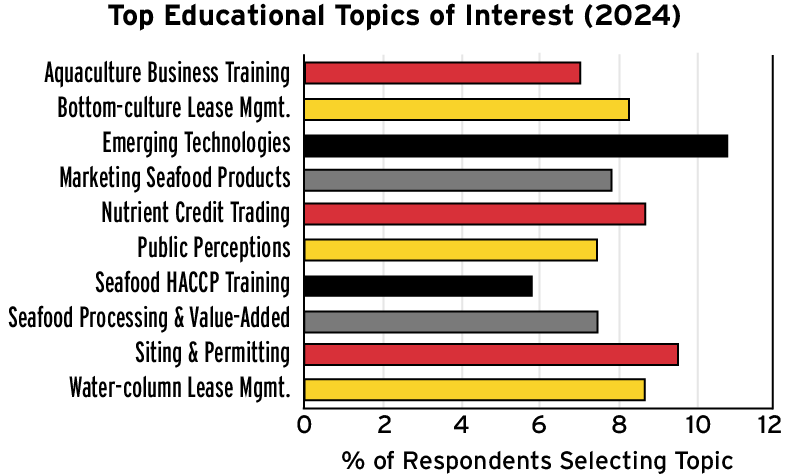
The top educational topics of interest mentioned by 2024 respondents (Figure 2) included:
- Emerging technologies for aquaculture and seafood processing (11%)
- Siting and permitting (10%)
- Nutrient Credit Trading Programs (9%)
- Water-column Lease Management (9%)
- Bottom-culture Lease Management (8%)
- Marketing Seafood Products (8%)
Other significant areas of interest indicated a need for comprehensive and advanced training, including value-added products, public perception, Hazard Analysis and Critical Control Point training, and nursery/hatchery operations.
In contrast, the top activity requested from the ACC in 2014 was streamlining the permit process (45%), followed by financing assistance and general production training. This indicates that while permitting remains a major concern in 2024, the demand has shifted toward advanced technical knowledge and innovation.
Conclusion
Over the past decade, as Maryland’s shellfish aquaculture industry has grown in professionalism and complexity, the technical needs of its practitioners and leaders have grown proportionately. Despite being separated by ten years, the 2014 and 2024 surveys revealed consistent concerns, particularly around regulatory barriers and the challenge of securing permits and leases. In 2024, 74% of respondents indicated that these issues impacted their businesses “a lot,” more than doubling from the 34.7% who reported the same in 2014. Other enduring challenges reported by survey takers included the availability and cost of shell or substrate. While participants expressed a continued interest in educational content related to permitting, they also indicated a new interest in receiving information about technological advances in aquaculture. While the 2024 Needs Assessment suggests that longstanding issues like permitting and site selection persist—and in some cases have intensified—there is a clear shift toward innovation, market diversification, and workforce challenges. UME and its partners should consider these findings when shaping future support, training, and policy recommendations for the state’s aquaculture sector, with the understanding that ongoing adaptive support is essential for sustaining this vital industry. Those wishing access to raw anonymized results from the survey should reach out to the authors directly.
References
Lazur, A. (2014, November). 2014 Aquaculture Industry Needs Assessment: Results Summary. Maryland Aquaculture Coordinating Council.
Richter, A., Storey, J., & Killian, S. (2021). The digital workplace: Balancing technology, people and processes. Journal of Business Research, 124, 604– 613. https://doi.org/10.1016/j.jbusres.2020.10.069
MATT PARKER
mparke11@umd.edu
DON WEBSTER
dwebster@umd.edu
ALLEN PATTILLO
dapatt@umd.edu
This publication, A 2024 Needs Assessment of the Shellfish Aquaculture Industry in Maryland (FS- 2025-0798), is a part of a collection produced by the University of Maryland Extension within the College of Agriculture and Natural Resources.
The information presented has met UME peer-review standards, including internal and external technical review. For help accessing this or any UME publication contact: itaccessibility@umd.edu
For more information on this and other topics, visit the University of Maryland Extension website at extension.umd.edu
University programs, activities, and facilities are available to all without regard to race, color, sex, gender identity or expression, sexual orientation, marital status, age, national origin, political affiliation, physical or mental disability, religion, protected veteran status, genetic information, personal appearance, or any other legally protected class.
When citing this publication, please use the suggested format:
Parker, M., Webster, D., & Pattillo, A. (2026). A 2024 Needs Assessment of the Shellfish Aquaculture Industry in Maryland (FS-2025-0798). University of Maryland Extension. go.umd.edu/EBR-2025-0798.