
FS-2022-0646 | February 2023
Working on Solar Panels and Power Output
Introduction

Solar photovoltaic (PV) systems are becoming an increasingly common sight on urban rooftops and rural properties across Maryland. The agricultural sector was an early adopter of off-grid solar PV systems as a remote energy source, but net-metered solar electric systems are becoming more enticing for many applications due to declining installation costs and various energy policies. According to the International Renewable Energy Agency, the “levelized cost” for large-scale solar has decreased by 88% since 2010, falling from $0.417/kWh in 2010 to $0.048/kWh in 2021 (IRENA, 2020). “Levelized cost” is the estimated revenue required to build and operate an energy system over a specified cost recovery period, generally expressed in months or years. Considering these factors, many homes, farms and businesses in the state are installing solar PV systems with the average breakeven timeframe for residential systems being projected as 6.2 years (Lane, 2023).
The environmental benefits of solar PV are also substantial, particularly considering the average Maryland home consumes nearly 12,000 kilowatt hours (kWh) of electricity annually (EIA, 2021). Producing 50% of that demand with a solar PV system would offset the equivalent carbon dioxide emissions from over 85,000 pounds of coal burned, or about 26 tons of landfill waste, over a twenty-year period based on calculations performed with the EPA’s Greenhouse Gas Equivalencies Calculator (EPA, 2022). The total amount of water needed to generate solar electricity is also dramatically less than the manufacturing processes of more traditional electricity sources such as nuclear, natural gas, and coal-fired facilities.
In light of this market growth, and the widespread potential for solar PV in the state, it’s important to understand how much power can actually be generated by these systems. To do so, it may be helpful to recognize that a solar module (commonly called a solar panel) is composed of individual photovoltaic cells (commonly called solar cells). Most commercially-available photovoltaic cells are fabricated from silicon (Woodhouse et al., 2016), with each photovoltaic cell in a solar module being a semi-conductor that converts the energy of light into electrical energy. The power of a solar module is, therefore, a product of the power generated by all of its individual photovoltaic cells (see Figure 1).
While many may assume that a solar module can continuously deliver power at the nameplate rating specified by the manufacturer, the actual electrical power delivered by the solar module is a function of its position and the current environmental conditions. While it’s generally safe to assume that larger solar modules can produce more electrical power than smaller solar modules, the actual output power of a solar module can be measured using a multimeter. A multimeter is a versatile and “must-have” tool that’s capable of measuring multiple electrical properties. A typical multimeter is equipped with a voltmeter, ammeter, and ohmmeter functionality, enabling it to measure electric voltage, current, and resistance. The performance and power output of a solar module can easily be determined by assessing the relationship between its voltage and current under different conditions. These measurements are particularly important when identifying defective solar modules and/or confirming the output of a solar module when its output parameters are unknown. This fact sheet demonstrates how the average consumer, with a simple set of tools, can calculate the real-world capabilities of their solar modules. In order to understand the power delivered by a typical solar module, it is essential to understand how to effectively interpret its electrical data.
How to interpret electrical data
Understanding Electricity
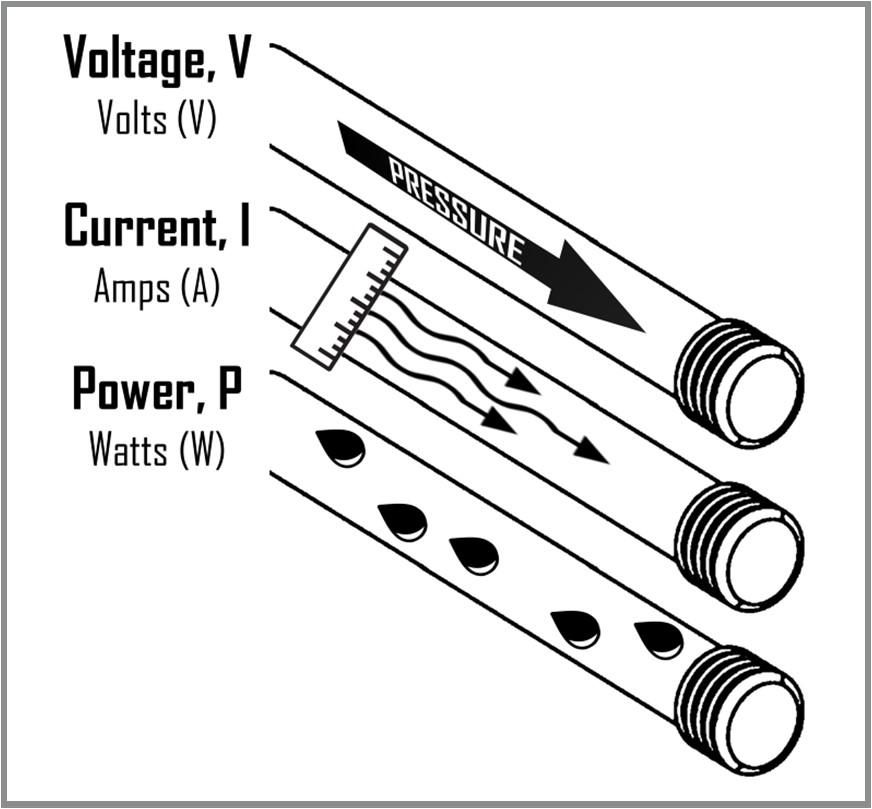
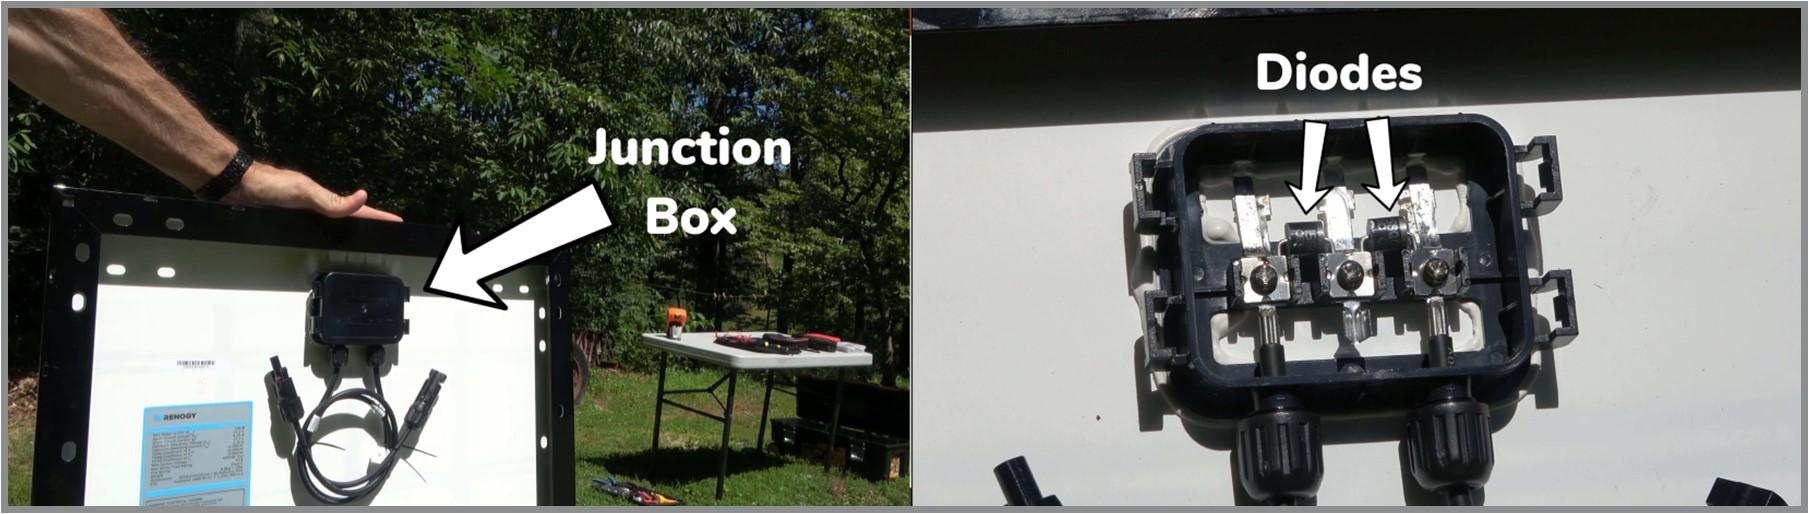
While most household appliances operate on the alternating current (AC) that’s available through standard wall outlets, solar modules produce direct current (DC) electricity. The flow of DC electricity is similar to how water flows through a garden hose (see Figure 2). With DC electricity, the flow of electrons occurs in only one direction, just like the flow of water travels in one direction inside a garden hose. DC electricity, likewise, flows through the series of photovoltaic cells forming a solar module. In this case, the positive conductor of one cell in the module is connected to the negative conductor of the next cell. The connectors of these solar cells are landed on terminals located in the junction box on the back of the solar module (see Figure 3). The junction box is also where any internal bypass diodes are located. These diodes serve as electrical valves that react to any resistance caused by shading on the solar module. When the module is shaded, the current will bypass the blocked row of cells, flowing through the diode instead.
Voltage is the difference in electrical potential between any two conductors, or between a conductor and ground. Voltage is denoted by the letter “V” and is measured in volts (V). In the garden hose analogy, voltage is like the pressure that pushes water through the hose (Figure 2). The voltage of a solar module is simply the sum of all of its cells. Current, on the other hand, is the strength or flow rate of the electric charge, or electrons, inside of the electrical conductor. Current is denoted by the letter “I” and is measured in amperes or amps (A). Current is impacted by the size of the wire or PV cell, just as water is impacted by the diameter of the garden hose. Wider hoses will also allow more water to flow through. Lastly, power measures capacity and may be compared to the volume of water flowing from a garden hose, at a specific pressure and diameter. Power is denoted by the letter “P” and is typically measured in watts (W), while larger electrical systems may be measured in kilowatts (1 kW = 1,000 W) or megawatts (1 MW = 1,000,000 W). Solar modules typically range in size from a power output of 5 W to over 400 W. While power refers to the rate that electricity is produced or consumed, energy itself refers to the total amount of electricity used.
Electrical energy is commonly measured in kilowatt-hours, or kWh. Most electric utility companies bill their customers for total kWh energy consumption and peak kW power consumption.
Electrical Data Label
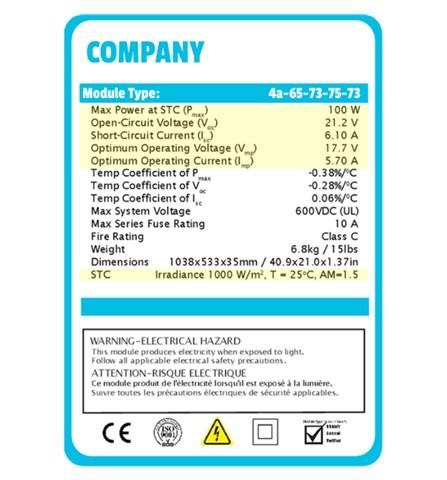
The important electrical parameters of a solar module will be specified on the data label that’s commonly affixed to the back of the solar module itself. A typical data label for a polycrystalline solar module is shown in Figure 4. It should first be noted, that the solar industry uses standard test conditions (STC) as a consistent means for measuring solar module output under ideal environmental conditions. Solar modules are rated under these standard test conditions which specify a solar irradiance of 1,000 watts per square meter (W/m²). This is the equivalent of one peak sun hour, or full sun, which typically occurs between 9:00 AM and 3:00 PM on a clear, sunny day. Standard test conditions also specify a solar cell temperature of 25°C (77°F) and air mass of 1.5. An air mass of 1.5 accounts for the angular path of solar radiation through the atmosphere based on a 37° tilt (i.e., the average latitude of the 48 contiguous United States).
With that said, the actual power output of a solar module will be different with any changes in solar irradiance, temperature, or atmosphere. A solar irradiance of only 500 W/m², for instance, would likely result in half of the expected output. Hotter temperatures will also cause the power of a solar module to drop.
Other electrical parameters detailed on the data label shown in Figure 4 are the maximum power (Pmax) at a value of 100 watts (W), as well as the open circuit voltage (Voc) and short-circuit current (Isc) of the solar module which have been specified as 21.2 volts and 6.10 amps, respectively. Open circuit voltage is measured when no current is being drawn, while short circuit current occurs when there is a zero voltage difference. Therefore, open circuit voltage and short-circuit current represent their maximum respective values at full sunlight (and standard temperature of 25°C). Higher temperatures will decrease this maximum voltage, while lower temperatures will increase this maximum voltage. These maximum values are measured when no electrical load is connected to the solar module. However, the solar module will not produce any power without an electrical load connected to it. While any standard 12-volt module will produce a similar output under full sunlight, most will operate at lower output levels in the real world due to any deviations from standard test conditions and/or module degradation.
The data label also provides the optimum operating voltage (Vmp) and optimum operating current (Imp). In the example shown in Figure 4, these values are specified as 17.7 V and 5.70 A, respectively. At full sun, the voltage and current measured without an electrical load (Voc and Isc) will be greater than their respective values measured under electrical load (Vmp and Imp). This trend may be attributed to the electrical resistance that is introduced to the circuit whenever an electrical load is connected to the panel. While all of these electrical parameters are commonly found on the back of a PV module, measuring voltage and current can be useful in identifying defective modules and/or confirming the output of a module when the output parameters are unknown.
How to measure voltage and current
While digital multimeters are commonly used to measure the voltage and current of solar modules, these devices must be equipped with direct current (DC) capabilities. A known operating circuit (such as a common household battery) can be used to check if a multimeter is working properly. Start by selecting a voltage range or current setting that’s higher than the levels expected with the actual electrical system in order to prevent any damage to the multimeter. In measuring a 12-volt car battery, for example, select the next highest voltage option (e.g., 20 DCV). Connect the black test lead to the common (COM) port of the multimeter. Then, connect the red test lead to the appropriate voltage or current port to measure voltage or current, respectively. Next, connect red and black test leads to the positive (+) and negative (–) battery terminals, respectively. While a negative sign will be displayed if the test leads are reversed, the magnitude of the measured voltage should still closely match the battery’s rated voltage. Be sure to only handle the insulated handles of the test leads, since contact with the metal portions could cause electrical shock. A multimeter can similarly be used to check the electrical output (i.e., voltage and current) of a PV module.
Open-Circuit Voltage (Voc)
Open circuit voltage (Voc) is evaluated without any electrical load connected to the solar module. In this case, the open terminals (infinite resistance) of the module have no current flow (I=0) with the electrons unable to flow through an incomplete circuit. As such, open circuit voltage reflects the maximum electrical pressure when no current is flowing. As a result, no electrical power is generated (P=0). This can be mathematically verified by multiplying the voltage (V) by current (I), according to Watt’s Law:
P = V × I = V × 0 = 0
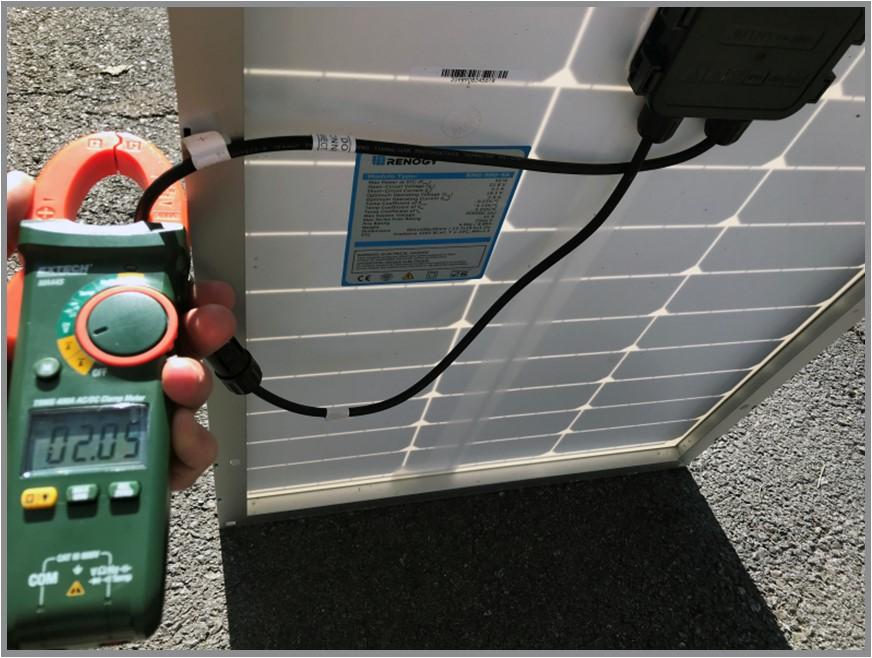
Measuring the voltage across the open terminals requires the use of a multimeter with a voltmeter functionality having a high enough scale to read the open circuit voltage. To perform this measurement, connect the positive (red) and common (black) test leads of the multimeter to the positive (+) and negative (–) lead of the solar module, respectively (see Figure 5). With the DC voltage selected on the multimeter, the measured value should closely match the rated open circuit voltage that’s referenced on the module’s data label. Lower values could be a result of reduced sunlight intensity compared to full sun.

Short-Circuit Current (Isc)
Short-circuit current (Isc) is the maximum current flowing through a closed circuit without an electrical load (no resistance). A closed circuit is created when the positive (+) and negative (–) terminal of a solar module are shorted, or connected together (see Figure 6). Since there’s no output voltage with the closed circuit (V=0), no electrical power is generated (P=0) as follows from Watt’s Law:
P = V × I = 0 × I = 0
Multimeters having an ammeter functionality can be spliced into an electrical circuit to measure the circuit’s current. Current thereby flows through the multimeter. A clamp-on ammeter, on the other hand, indirectly measures current by inductively sensing the electric field surrounding a wire. In this case, there is no need to break the circuit or splice in a multimeter. Measuring the short-circuit current of a solar module using a clamp-on ammeter simply requires the positive and negative terminals of the solar module to be connected to each other as shown in Figure 6. The module should be temporarily covered, or flipped upside down, to prevent exposure to the sun while this connection is being made between the terminals. Current is then measured by enclosing a single conductor of the completed circuit within the clamps of the ammeter and selecting the DC setting. While measured values should closely match those rated by the manufacturer under full sun, lower values may be expected during reduced solar intensity.
How to measure power
Photovoltaic modules only provide useable electricity when they are connected to an electric load. For this reason, the actual output power generated by a solar module is dependent on the electrical load that’s connected to it. This output power can be evaluated using a simple electrical load, like resistance. In practice, we may use various power resistors, or an adjustable rheostat, to measure the power of a solar module.
Variable Resistance
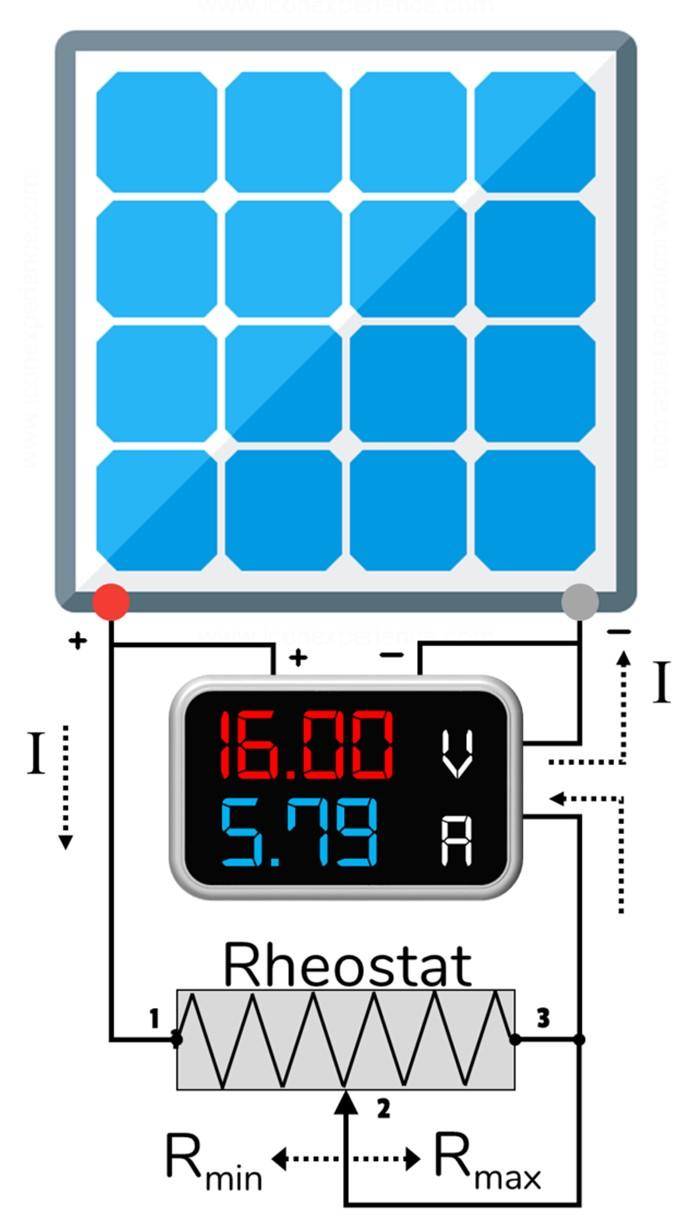
The range of dynamic resistive values that will be used in this assessment should first be determined based on the theoretical maximum power of the solar module. For this example, the product of the open circuit voltage found on the module’s data label (Voc = 21.2 V) multiplied by the module’s short-circuit current (Isc = 6.10 A) would equal a theoretical maximum power (Pmax) of 129.32 W. To be safe and thorough, we might assume the maximum power and voltage of the solar module to be 150 W and 30 V, respectively. A variation of Joule’s Law can then be used to determine the dynamic resistive value as follows:
R = V² ÷ P = 30² ÷ 150 = 6 ꭥ
Using a rheostat, the externally-connected load resistance can be varied 0 to 6 ohms (Ω) in increments of 1 ohm (Ω). The maximum output power of the solar module will occur within this range of external resistive values. The configuration for this evaluation is shown in Figure 7 while the measured voltage and current values are summarized in Table 1. The output power of the solar module is also summarized in Table 1 based on Ohm’s Law and the measured values of voltage and current. For reference, an open circuit voltage implies infinite resistance, while a short-circuit current implies zero resistance.
| Resistance, R (Ohms, Ω) | Voltage, V (volts, V) | Current, I (amperes, A) | Power, P (watts, W) |
|---|---|---|---|
| Open Circuit | 21.2 | 0 | 0 |
| 6 | 19.7 | 3.61 | 71.0 |
| 5 | 19.0 | 4.13 | 78.4 |
| 4 | 17.8 | 4.84 | 86.2 |
|
3 |
16.0 |
5.79 |
92.4 |
| 2 | 11.0 | 5.98 | 65.6 |
| 1 | 5.7 | 6.18 | 35.1 |
| Short-Circuit | 0 | 6.10 | 0 |
Based on the tabulated results, a power of 92.4 watts (W) is the closest match to the rated maximum power (Pmax) of 100 watts (W) as reported on the data label of the solar module. This power level occurs at a resistance, voltage, and current level of 3 ohms (Ω), 16.0 volts (V), and 5.9 amps (A), respectively. This approximation can be further refined using the module’s rated values of optimum operating voltage (Vmp) and optimum operating current (Imp) (see Figure 4 above). In this case, the target resistance can be evaluated based on a variation of Ohm’s Law as follows:
R = Vmp ÷ Imp = 17.7 ÷ 5.70 = 3.11
While the maximum power (Pmax) of solar modules varies depending on their size and efficiency, the maximum power of this particular solar module was generated at a resistance of 3.11 ohms (Ω). Matching the electrical load to the characteristic resistance of the solar module will maximize its power and efficiency.
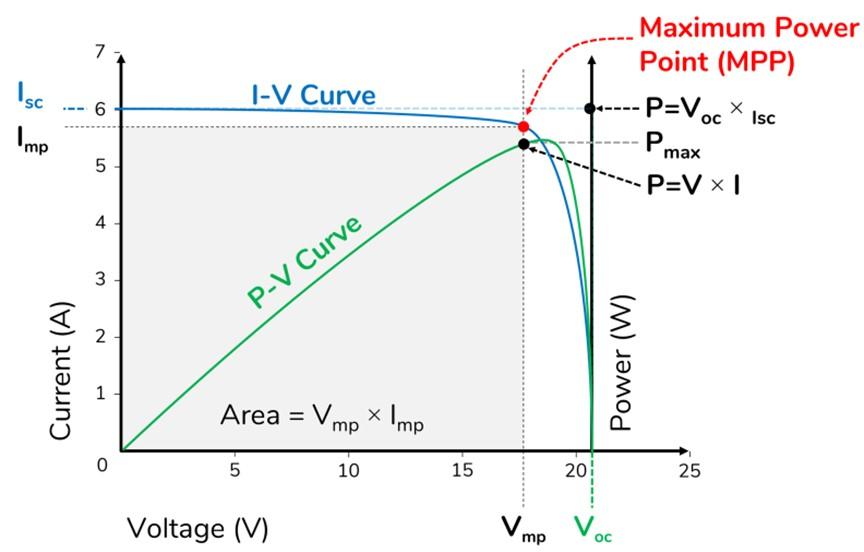
Plotting an I-V Curve
The measured voltage is plotted against the current in Figure 8. This characteristic current and voltage (I-V) curve provides a detailed description of the electrical characteristics of a solar cell, module, or array which can be used in determining output performance and efficiency. As evidenced in this characteristic I-V curve, solar photovoltaics are current source devices rather than voltage source devices, like a battery. While batteries supply a constant terminal voltage (e.g., 12V, 24V) and variable currents to electrical loads, solar modules provide constant current over a wide range of voltages, assuming no changes in the environmental conditions. It can also be observed that power is equal to zero for both the open-circuit (I=0) and short-circuit (V=0) conditions. The maximum power point (MPP) indicated in the I-V curve represents the point at which the solar module generates its maximum power.
Conclusions
Knowing how to measure the voltage, current and power of a solar module is important in order to ensure proper functioning of a solar PV system. These measurements are particularly important for identifying defective solar modules and/or confirming the output of a solar module whose output parameters are unknown. When evaluating module performance, all instructions from the manufacturer should be fully read and understood. Safe practices should also be followed before taking any measurements or making any adjustments to the solar PV system. Before making any connections to a solar module, turn it away from the sun, cover or shade it completely, and/or de-energize the array using a disconnect switch. This will help to prevent electrical shock or any damage from occurring to the system. Voltmeters and ammeters can determine if voltage or current is traveling through the system. A de-energized system should provide voltage and current readings of zero (0.00), but consult a licensed electrician if you have any questions or doubts.
References
- EIA. (2021). Average Monthly Bill- Residential. U.S. Energy Information Administration. Washington, DC. Retrieved January 25, 2023, from https://www.eia.gov/electricity/sales_revenue_price/pdf/table5_a.pdf
- EPA. (2022). Energy and the Environment: Greenhouse Gas Equivalencies Calculator. U.S. Environmental Protection Agency. Washington, DC. Retrieved January 25, 2023, from https://www.epa.gov/energy/greenhouse-gas-equivalencies-calculator
- IRENA. (2022). Renewable Power Generation Costs in 2021 (978-92-9260-452-3). International Renewable Energy Agency. Abu Dhabi. https://www.irena.org/Publications/2022/Jul/Renewable-Power-Generation-Costs-in-2021
- Lane, C. (2023). Solar power in Maryland. Solar-Estimate. Retrieved January 25, 2023, from https://www.solar-estimate.org/residential-solar/solar-panels/maryland
- Woodhouse, Michael, Rebecca Jones-Albertus, David Feldman, Ran Fu, Kelsey Horowitz, Donald Chung, Dirk Jordan, and Sarah Kurtz. 2016. On the Path to SunShot: The Role of Advancements in Solar Photovoltaic Efficiency, Reliability, and Costs. Golden, CO: National Renewable Energy Laboratory. NREL/TP-6A20-65872. http://www.nrel.gov/docs/fy16osti/65872.pdf
Funding acknowledgement

This material is based upon work supported by the National Institute of Food and Agriculture, U.S. Department of Agriculture, through the Northeast Sustainable Agriculture Research and Education program under subaward # ENE20-165-34268
All images by the author
DREW SCHIAVONE, PH.D.
dschiavo@umd.edu
This publication, Working on Solar Panels and Power Output (FS-2022-0646) is a part of a collection produced by the University of Maryland Extension within the College of Agriculture and Natural Resources.
The information presented has met UME peer-review standards, including internal and external technical review. For help accessing this or any UME publication contact: itaccessibility@umd.edu
For more information on this and other topics, visit the University of Maryland Extension website at extension.umd.edu
University programs, activities, and facilities are available to all without regard to race, color, sex, gender identity or expression, sexual orientation, marital status, age, national origin, political affiliation, physical or mental disability, religion, protected veteran status, genetic information, personal appearance, or any other legally protected class.
Related Resources
-
Solar Module Guide >
Solar Module Guide > -
Working on Solar Design and System Sizing (FS-2023-0655) >
Working on Solar Design and System Sizing (FS-2023-0655) >