
FS-2023-0655 | June 2023
Working on Solar Design and System Sizing
Introduction
While solar energy generates only 4.85% of Maryland’s total in-state electricity (EIA, 2022b), the state’s solar photovoltaic (PV) market is rapidly growing with 1,670 Megawatts (MW) of installed capacity and a growth projection of 1,610 MW over the next 5 years (SEIA, 2023). While much of this market growth is occurring in the utility-scale sector, solar PV is also being used by many homes, farms and businesses across the state to generate renewable electricity. Solar PV systems are also being widely deployed in remote field applications where grid-interconnection may be cost-prohibitive or unavailable (e.g., electric fences, lights, or water pumps). Additional motivations for installing solar PV include avoiding power outages, achieving energy independence, improving an environmental footprint, and supporting local economic development.
The projected size of a solar PV system will depend on the specific application of the project, as well as any particular goals that you may have. While large commercial and utility-scale projects come with their own unique design challenges, the information provided here primarily addresses small-scale, behind-the-meter, solar PV systems intended for use in a home, farm, or business. Specifically, this factsheet will help you to estimate the system size and the number of solar panels that would be needed to meet your electrical demand. The size of a PV system depends on your electrical use (called energy demand); your solar resource (based on your location); and the overall system efficiency (estimated using a derate factor), among other considerations (e.g., economics, zoning, net metering, permitting). Review this factsheet to learn how to assess your electrical loads, to identify solar energy levels at a given location, and to perform a simple calculation to correlate your electrical demand to solar PV production. A properly designed PV system can provide improved energy production and cost savings.
How to perform a load assessment
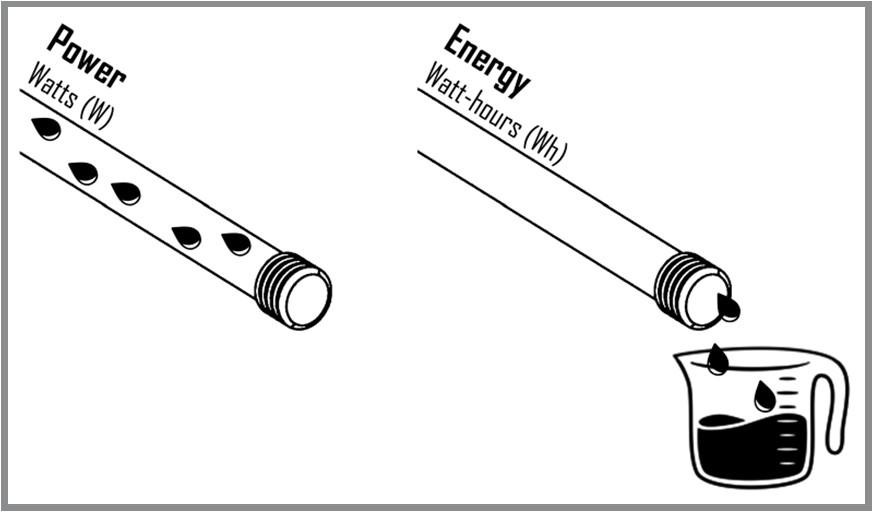
It’s important to understand how electricity is used before installing a solar electric system. The size of the PV system that you design will be impacted by the amount of electricity that you use, as well as the time in which that electricity is used. To better understand your use of electricity, it may be useful to distinguish between power and energy. Generally speaking, power measures capacity, while energy measures delivery. To further highlight the difference between power and energy, you may want to consider the electricity flowing through a circuit to be analogous to water flowing through a garden hose (Figure 1). In this analogy, power is like the amount of water that can flow through the hose at a given pressure and diameter. Electric power is commonly measured in watts (W), but larger systems may be measured in kilowatts (1 kW = 1,000 W) or megawatts (1 MW = 1,000,000 W). Energy, on the other hand, is like measuring the volume of water that has flowed through the hose over a period of time. While electric energy is commonly measured in watt-hours (Wh), most electric utility bills will report energy in terms of kilowatt-hours (1 kWh = 1,000 Wh).
Itemized Loads
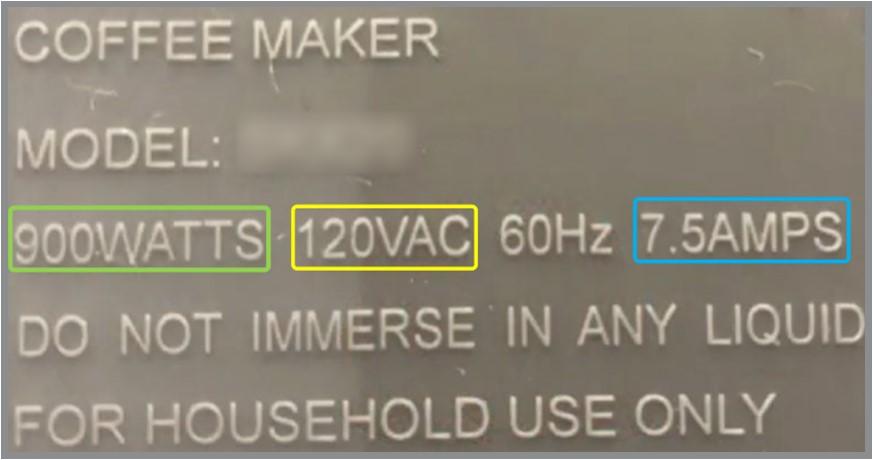
There are a couple ways to assess your electrical loads. One way to assess the electrical energy used in your home, farm or business is to create an inventory by itemizing the individual electrical loads and appliances that receive power. Detailed estimates of each electrical load are particularly important for off-grid and battery-integrated PV systems to ensure that sufficient power is available when needed. A grid-connected PV system, on the other hand, supplements your power requirements with energy from the electric utility grid (through a mechanism called net metering). While inventories are not as important with grid-connected systems, inventories for off-grid systems will be based on the power rating of each device, as well as the amount of time that you intend to operate the device. You can use the load analysis template found in Appendix A, or create your own list. Power ratings are often found on the device itself, within its operating manual, or through the manufacturer’s website. Figure 2, for example, shows a power specification label for a standard coffee maker. If the power rating of a device cannot be determined from any of these sources, then you can multiply the device’s current in amps (A) by its operating voltage (typically 120 or 240 VAC).
The energy consumed by each electrical load can then be calculated as a product of the device’s power (W) and operational time (hours). As an example, a 100 W light bulb that has been turned on for 12 hours would consume 1,200 watt-hours (Wh), or 1.2 kilowatt-hours (kWh), of electricity. Additional examples are provided in Appendix A. Particular attention should also be given to any electrical load that has a motor (e.g., a refrigerator, a washing machine, or a well pump), because these devices experience a brief power surge when they begin operating. Peak wattage is another important consideration which represents the total power of all the electrical loads that may be running simultaneously. Although it’s outside the purview of this factsheet, surge power and peak wattage can also be particularly useful in sizing a solar inverter. Seasonal energy demands (e.g., air conditioning and heating) should also be considered in this process to ensure sufficient energy production year round. Divide your annual energy demand (kWh/year) by 365 days to determine your daily energy demand (kWh/day).
Utility Bills
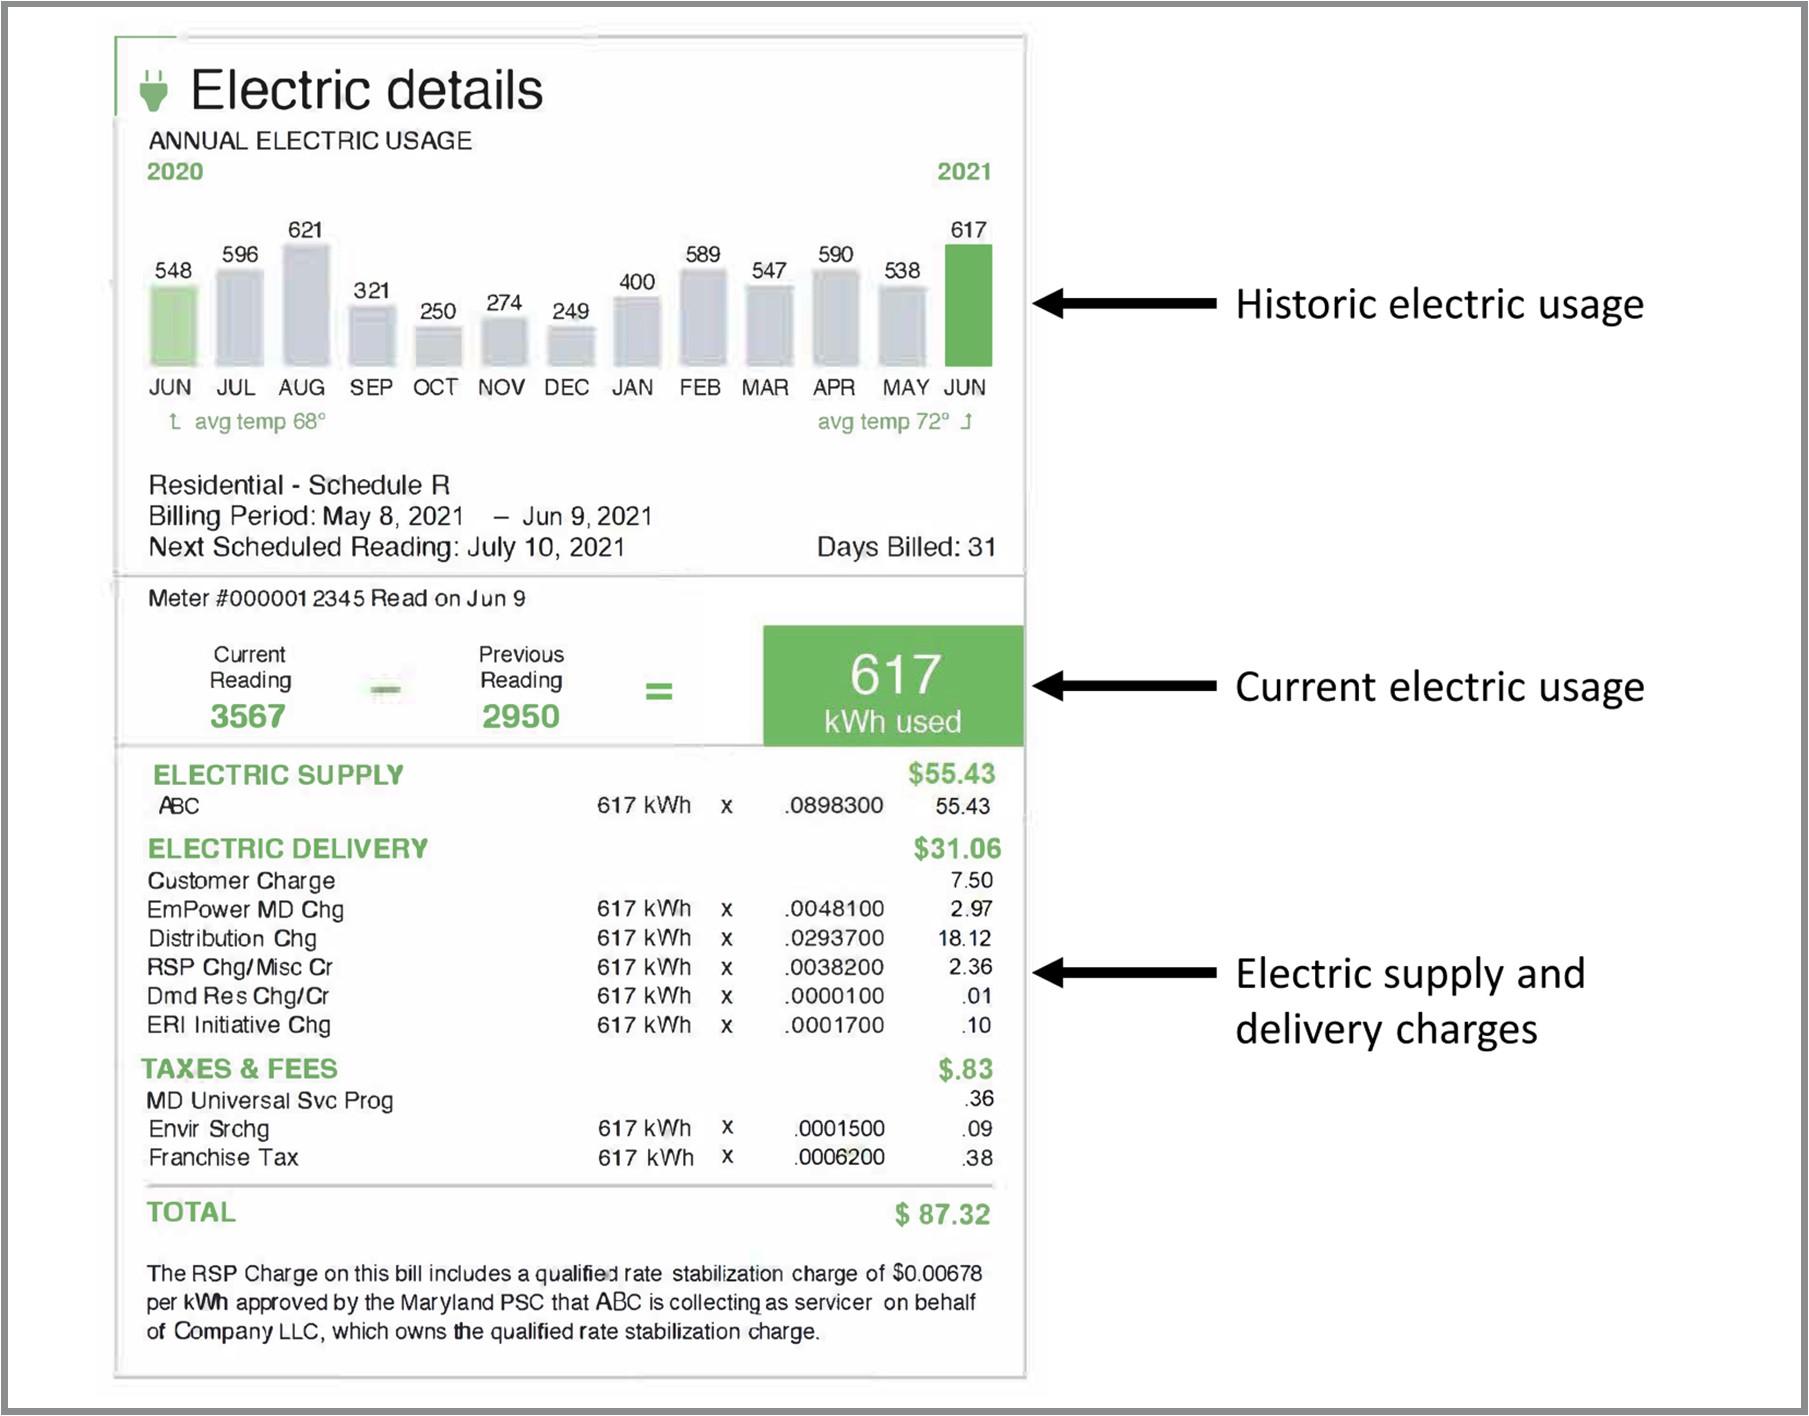
An easier way to assess energy demand is to consider the historic energy usage of your home, farm or business based on your electric utility bills. This method is particularly useful for those aiming to generate enough solar electricity to cover their entire annual electricity usage. The consumption charges found on your electric utility bill reflect the amount of electricity being consumed as measured in kilowatt-hours (kWh). An electric utility bill will list your electricity usage for the current billing cycle in kilowatt-hours (kWh), and will often provide a summary of your monthly energy usage over the course of a year (Figure 3). Determine your annual energy demand by totaling your monthly electricity usage over the past 12 months. For reference, the average Maryland household consumed 12,189 kWh of electricity in 2021 (EIA, 2022a; EIA, 2023).
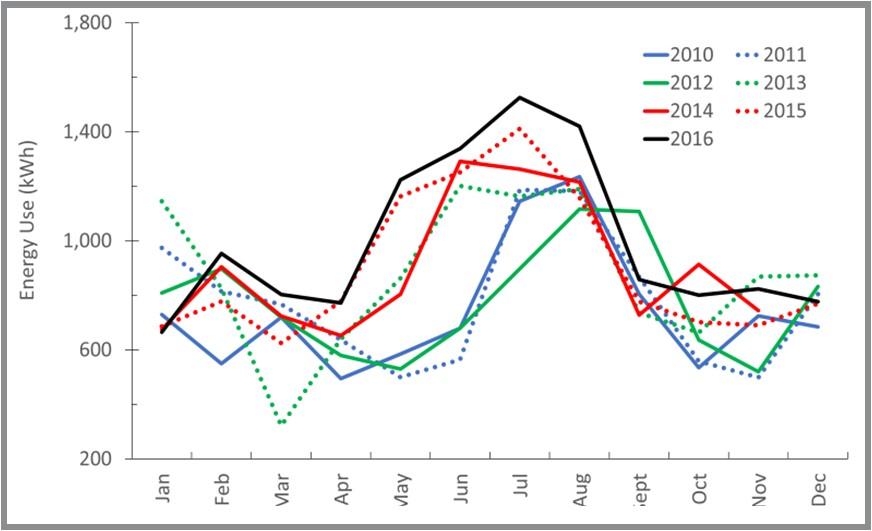
It should be noted, however, that any change in weather, energy efficiency, or operation will cause your electrical usage to vary from year to year. Extreme temperatures in the winter or summer could, for instance, raise the demand for electric heating or cooling. As an example, the monthly energy use for a single-family home in Bethesda, Maryland is shown in Figure 4 over a number of years. Seasonal trends (i.e., low energy usage in the spring and fall) and annual averages (i.e., lower energy in 2011, higher energy in 2016) can be observed in this example. Any changes to a site’s energy efficiency or management practices could also impact energy demand for better or worse. To identify any unique trends or unexpected variability, energy experts often recommend that you observe at least 2 years of historic energy use when sizing a PV system. In addition to reviewing your historical energy use, be sure to consider any potential changes to your energy profile in the near future (e.g., energy efficiency upgrades or electric vehicles).
Conservation and Efficiency
Energy conservation and efficiency are the most cost-effective ways to reduce your overall energy demand. With simple upgrades, you can dramatically reduce your energy use and bills. Unless you already have a very energy-efficient home, consider energy conservation and efficiency measures before you invest in solar panels. Replacing inefficient lights, appliances, equipment, and machinery can significantly reduce the size and cost of your solar electric system. Energy conservation and efficiency also provide the foundation for smaller, more efficient and affordable solar electric systems since the size of a PV system is based on the amount of electricity used. The less electricity you use, the smaller, more efficient and affordable the PV system will become. It is almost always cheaper to reduce energy use than to buy a larger renewable energy system.
How to assess your solar resource
While sunlight is widely available throughout the state, not every building or site has convenient, or sufficient, access to that sunlight. The amount, and specific location, of sunlight should be assessed at each site to determine the generating potential for a solar PV system. A solar resource assessment is essential to understanding the viability of solar PV at a given site as it can be used to estimate the annual production from a PV system. While a solar energy vendor or independent site assessor can evaluate your site, the following information will help you to assess the solar resource that’s available on your site.
Solar Resource
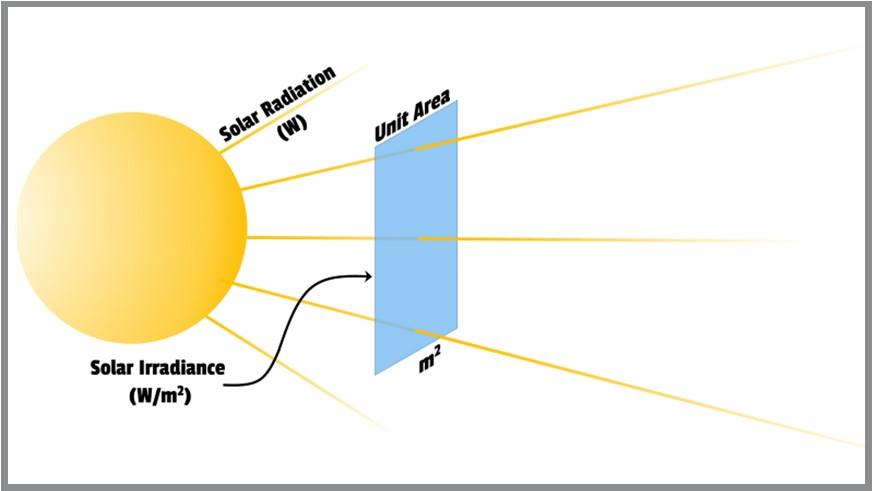
To conduct a solar resource assessment, begin by considering several related terms that are used to describe solar energy. Solar radiation is the power that emanates from the sun with its base units expressed in watts (W). Solar irradiance, on the other hand, represents the intensity, or instantaneous power, of solar energy delivered per unit area. So, the base units of solar irradiance are watts per square meter (W/m²). The distinction between solar radiation and solar irradiance is shown in Figure 5. An area that receives a larger amount of sunlight, or solar irradiance, will generate solar electricity more effectively. And since solar irradiance is an instantaneous measure of solar energy, it may change from minute to minute, being impacted by weather conditions (e.g., cloud cover and/or precipitation). As a result, PV production can dramatically decrease with a temporary fluctuation in solar irradiance arising from inclement weather or shading.
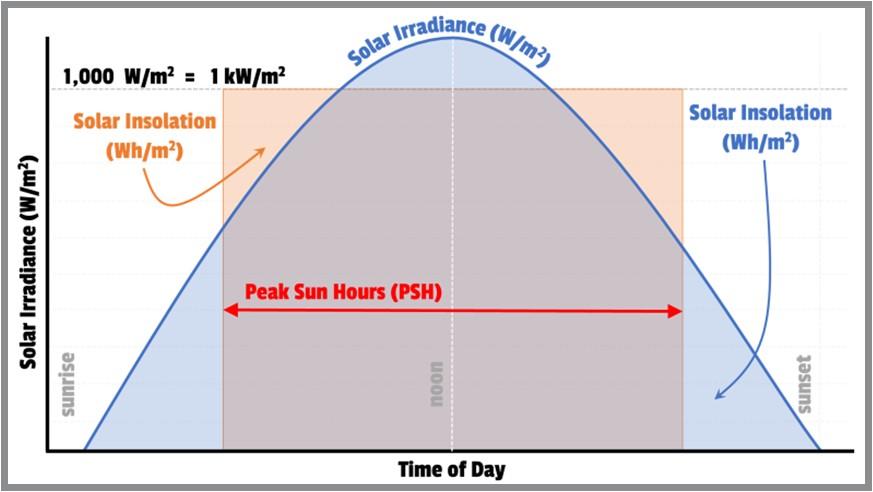
Solar insolation measures the irradiance that accumulates over some defined period of time (e.g., daily, monthly, or annually) with base units of watt-hours per meter squared (Wh/m²). Solar insolation is often used in describing the potential for solar energy production at a location since it effectively accounts for seasonal and weather-based variations. Peak sun hours (PSH) is a related term that represents the number of hours in a day that the sun would need to shine at its “peak intensity” (i.e., 1 kW/m²) to provide the actual daily amount of solar insolation. The output of most solar PV modules or panels are measured under standard test conditions with a corresponding peak intensity of 1 kW/m² (or 1,000 W/m²). Deviations from this peak intensity should be accounted for using a derate factor. The relationship between solar insolation and peak sun hours is shown in Figure 6. Since PSH refers to the amount of solar insolation that a location would receive if the sun were shining at peak intensity, PSH values will differ from the total hours from sunrise to sunset. And although PSH is numerically identical to daily solar insolation, the units for PSH are effectively hours per day (h/d), since PSH is based on a peak intensity of 1 kilowatt per square meter (1 kW/m²2). A location that receives 5 kWh/m² of solar insolation per day, for example, can be said to receive 5 hours per day of solar power at an intensity of 1 kW/m². This makes PSH values particularly useful considering that solar PV modules are also rated under standard test conditions of 1 kW/m².
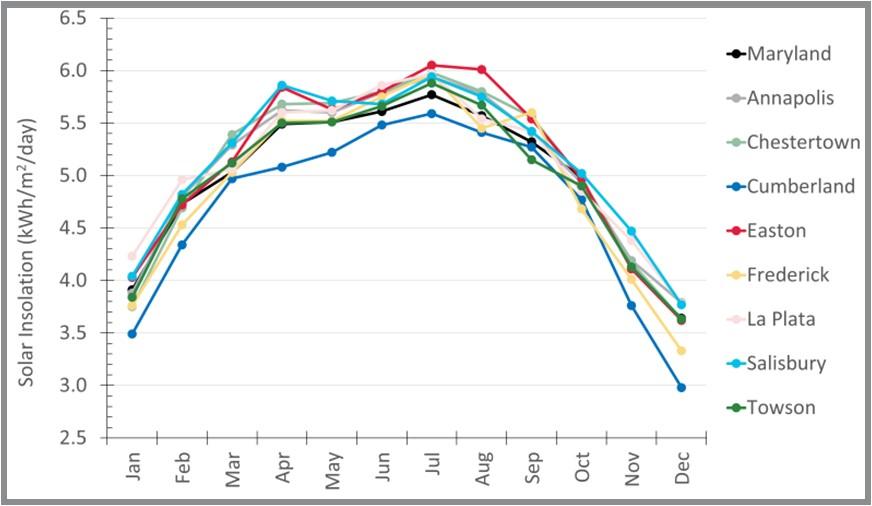
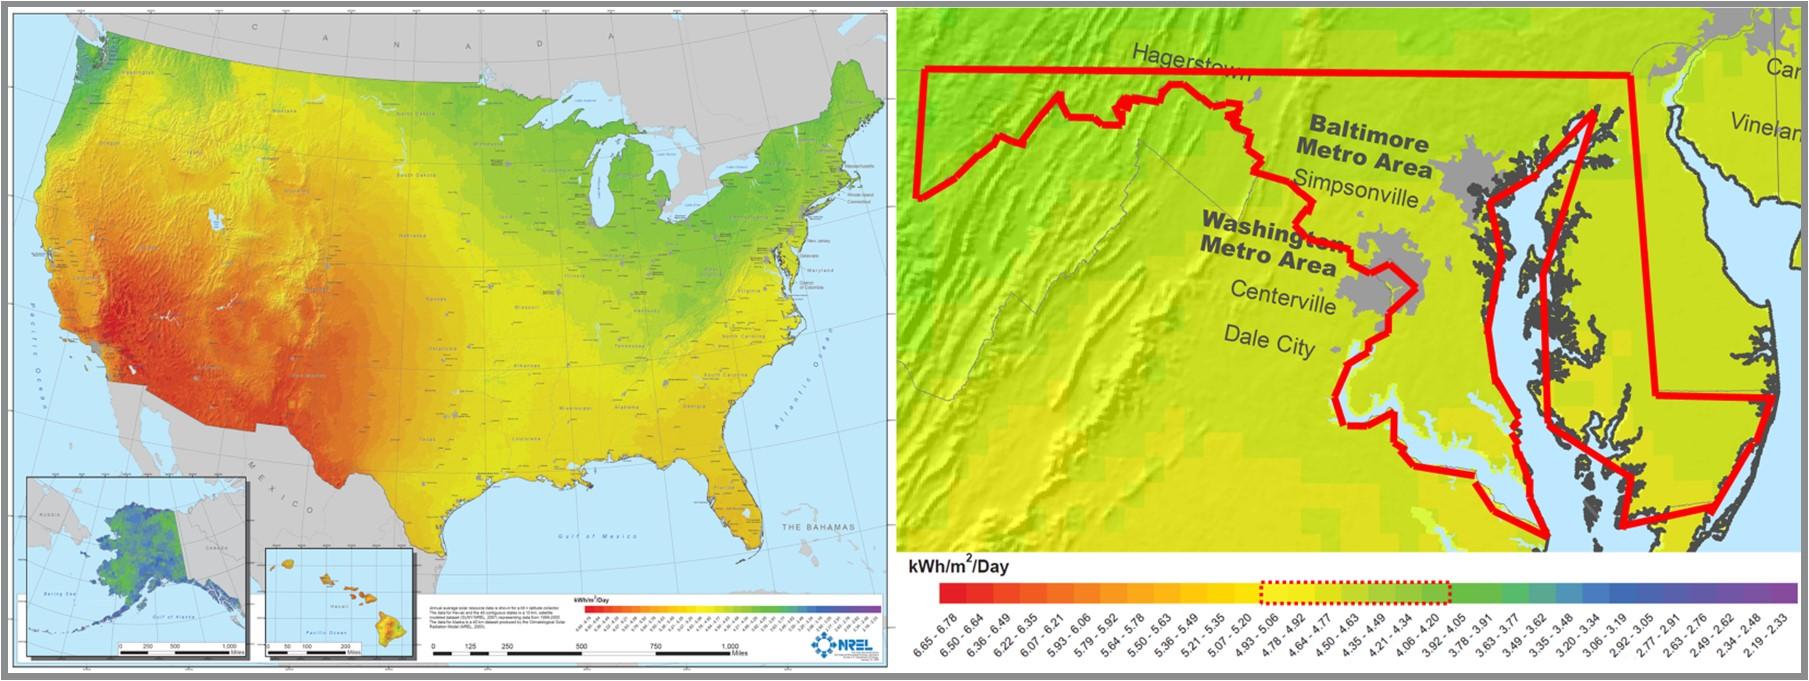
The average annual solar resource in Maryland ranges from about 3.92 sun-hours per day in Western Maryland to about 5.06 sun-hours per day on the Eastern Shore and along the Chesapeake Bay (Figure 7). The annual energy output of a solar electric system can be estimated using the average annual solar resource for a particular location. While these solar resource values are averaged over the entire year, summertime values may be significantly larger than those seen in the winter. In addition to these geographical changes in solar insolation, seasonal variations also influence solar insolation due to changes in weather and the length of day (Figure 8). The solar resource may be reduced in the winter, for instance, due to shorter days and widespread cloudiness across the state for longer periods of time. For additional insight on the insolation values reported in your area, you may want to reference the Solar Radiation Data Manual (Dunlap et al., 1994), the PVWatts Calculator (NREL, 2023), EnviroAtlas (U.S. EPA, 2015), or the Power Data Access Viewer (NASA, 2022) which can account for other variations in the orientation and tilt angle of a solar array.
Orientation & Tilt
Solar electric production is also impacted by the position of the sun in the sky relative to the surface of the solar module. The sun’s position in the sky (relative to the surface of the solar module) not only moves from east to west over the course of a day, but also from lower to higher positions in the sky between winter and summer seasons (Figure 9A). With these variations in mind, attention should be given to a panel’s east-to-west orientation (azimuthal angle), as well as the tilt of the panel from the horizontal (elevation angle) (Figure 9B). Proper orientation and tilting of a PV panel, based on the sun’s path in the sky, will help to optimize its solar exposure and the power that the PV panel produces.
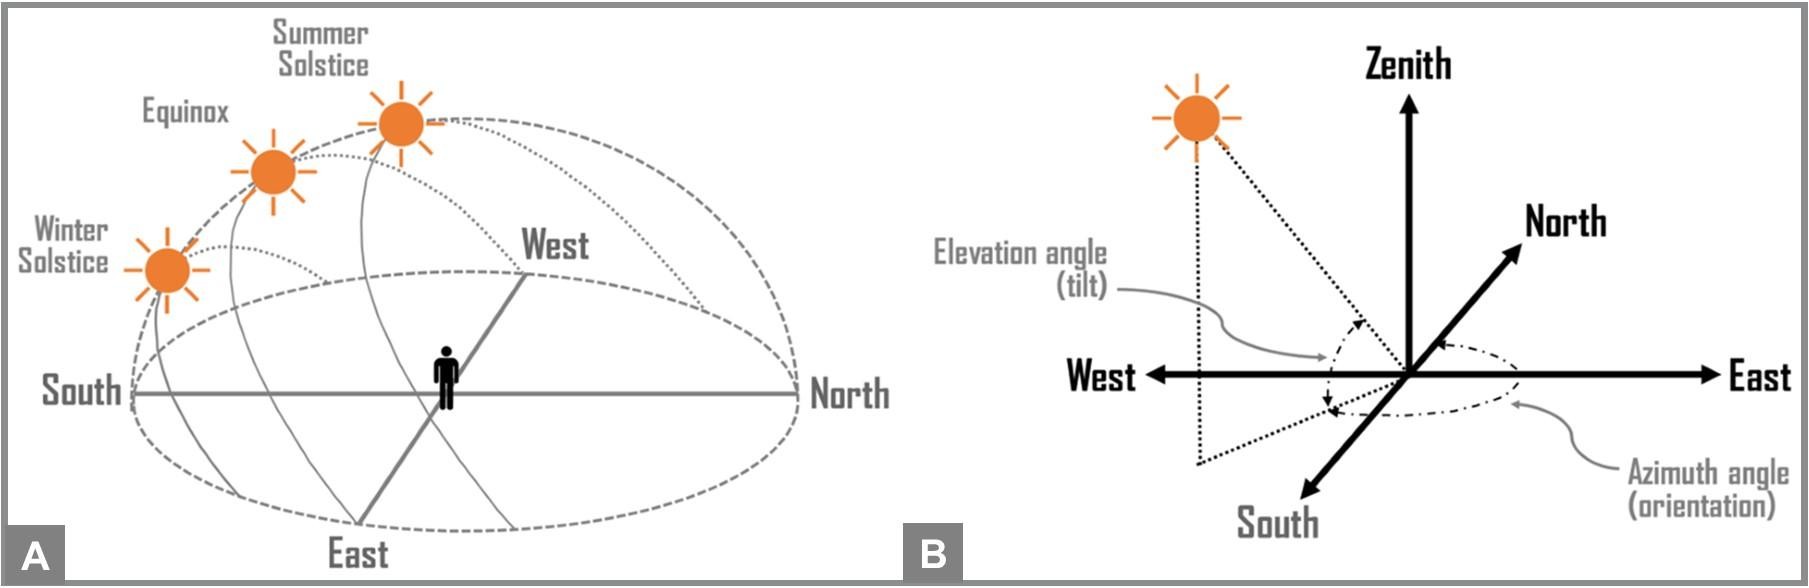
In the Northern Hemisphere, we observe the sun to rise in the east, culminate in the south, and set in the west. With our sunlight arriving predominately from the south, a solar panel should be oriented as close as possible to due south – allowing it to take full advantage of the sun’s path in the sky. Southeast- and southwest-facing panels, on the other hand, may perform about 5 percent less efficiently; eastern, western, and northern exposures will further reduce performance. Although deviating from a southern exposure can limit the direct sunlight, PV systems can still be economically-viable depending on the extent to which the output has been reduced. Hence, any deviations from a south-facing orientation should be weighed against individual priorities and rate structures.
To maximize year-round energy generation, a solar panel should be tilted at, or slightly less than, the local latitude. Solar panels in Maryland, for example, should be installed between 30-45 degrees, relative to the horizon. More electricity will typically be produced in the summer since the sun shines longer and sits higher in the sky. Any excess electricity generated in the summer can be credited to a consumer under Maryland’s net metering policy. These credits can then be used to offset winter electricity costs. The rules and regulations for Maryland’s net metering policy are established in Maryland Public Utilities Code Ann. §7-306 (2021) and COMAR 20.50.10 (2021) with utilities compensating net-metered generators for any excess credits at the average annual commodity electricity rate for their utility or electricity supplier. Tilting at a latitude plus 10 to 15 degrees, on the other hand, will prioritize winter production. A latitude minus 10 to 15 degrees will prioritize summer production. While rooftop systems are often mounted level to the roof’s surface, a lower-pitched roof could result in lower annual production unless the mounting structure compensates for the reduced angle.
Mechanical tracking systems can generally improve energy generation by following the sun’s path through the sky. Single-axis tracking systems follow the position of the sun as it moves from east to west, increasing PV generation 12%–25% relative to fixed-tilt systems. Dual-axis tracking systems not only track the sun as it moves east to west, but also follow the sun it as it moves from north to south, increasing PV generation by 30%–45% (Drury et al. 2012). Tracking systems, however, may substantially add to the system’s overall cost (due to both higher component costs and operation and maintenance costs), increase its physical footprint, and impose additional maintenance on its mechanical upkeep (Table 1). It may be noted, however, that while fixed-tilt systems use 13% less land than single-axis tracking on a capacity basis, a fixed-tilt system can use 16% more land on a generation basis. This difference is due to increased generation resulting from tracking technologies.
| Tracking Type | Component Costsᵃ ($/W) | O&M Costsᵃ ($/kW-yr) | Average Required Area, Totalᵇ (acres/MWAC) | Average Required Area, Directᵇ (acres/MWAC) |
|---|---|---|---|---|
| Fixed | 0.25 | 25.0 | 7.6 | 5.5 |
| Single-axis | 0.57 | 32.0 | 8.7 | 6.3 |
| Dual-axis | 0.98 | 27.5 | 13 | 9.4 |
ᵃ Additional mounting and tracking project costs and O&M estimates in 2011 US dollars (Drury et al., 2013).
ᵇLand-use requirements by PV tracking type for small PV (less than 20MW) on a capacity-weighted basis (Ong et al., 2013).
Shading Analysis
Solar panels are also sensitive to shading. Even partial or occasional shading can significantly reduce their energy production. Proper placement and configuration of a PV system will require the panels to be free from any shade cast by surrounding objects (e.g., HVAC systems, trees, power lines, and/or neighboring buildings). A shading assessment can identify the degree of shading to be expected at a location while establishing the site’s baseline for energy generation. Any area with shade may require removal of the obstruction or relocation of the PV system. Consider future land uses and vegetation growth on adjacent property as those conditions could change over a long period of time.
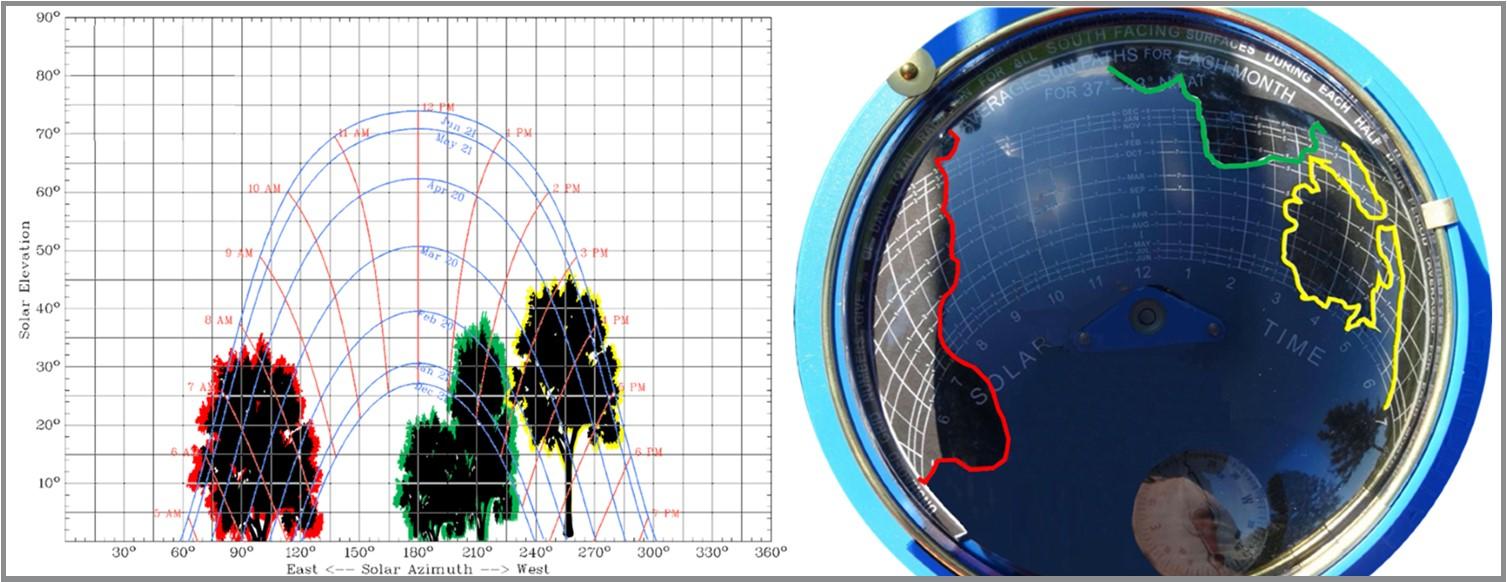
A sun path chart, which plots the sun’s path and position in the sky, can be used to identify any shade-free locations on your property that may be suitable for a PV system. Site-specific charts are available from the University of Oregon’s Sun Path Chart Program (UO Solar Radiation Monitoring Lab, 2022). Any nearby obstructions are traced onto the chart based on their angle of elevation and azimuth. Chart readings will indicate how much sunlight is blocked by each obstruction throughout the year. In Figure 10, for example, the tree highlighted in yellow will block sunlight from February to October, generally between the hours of 2:45pm and 5:00pm. A Solar Pathfinder is a tool that simplifies this process, allowing the user to easily determine what days of the year, and what times of the day, a particular location will be shaded. Production periods (i.e., those regions without superimposed reflections) can be tallied across the Solar Pathfinder’s chart to determine the monthly percentage of available sunlight (Table 2).
| 6:00 AM | 6:30 AM | 7:00 AM | 7:30 AM | 8:00 AM | 8:30 AM | 9:00 AM | 9:30 AM | 10:00 AM | 10:30 AM | 11:00 AM | 11:30 AM | 12:00 PM | 12:30 PM | 1:00 PM | 1:30 PM | 2:00 PM | 2:30 PM | 3:00 PM | 3:30 PM | 4:00 PM | 4:30 PM | 5:00 PM | 5:30 PM | TOTAL | |
|---|---|---|---|---|---|---|---|---|---|---|---|---|---|---|---|---|---|---|---|---|---|---|---|---|---|
| JAN |
0 |
0 |
0 |
0 |
0 |
4 | 5 | 6 | 7 | 7 | 8 | 8 | 8 | 8 |
0 |
0 |
0 |
0 |
0 |
3 |
0 |
0 |
0 |
0 |
64 |
| FEB |
0 |
0 |
0 |
0 |
0 |
4 | 5 | 6 | 7 | 7 | 7 | 8 | 8 | 7 |
0 |
0 |
0 |
0 |
0 |
3 |
2 |
0 |
0 |
0 |
64 |
| MAR |
0 |
0 |
0 |
0 |
0 |
4 | 5 | 6 | 6 | 7 | 7 | 7 | 7 | 7 | 7 | 6 | 6 | 5 |
0 |
0 |
0 |
2 |
0 |
0 |
82 |
| APR |
0 |
0 |
0 |
0 |
3 | 4 | 5 | 6 | 6 | 7 | 7 | 7 | 7 | 7 | 7 | 6 | 6 | 5 |
0 |
0 |
0 |
0 |
1 |
0 |
84 |
| MAY |
0 |
0 |
0 |
2 | 3 | 4 | 5 | 6 | 6 | 6 | 7 | 7 | 7 | 7 | 7 | 6 | 6 | 5 |
0 |
0 |
0 |
0 |
1 |
0 |
86 |
| JUN |
0 |
0 |
0 |
2 | 3 | 4 | 5 | 6 | 6 | 7 | 7 | 7 | 7 | 7 | 6 | 6 | 6 | 5 |
4 |
0 |
2 |
0 |
1 |
1 |
91 |
| JUL |
0 |
0 |
0 |
2 | 3 | 4 | 5 | 6 | 6 | 7 | 7 | 7 | 7 | 7 | 7 | 6 | 6 | 5 |
0 |
0 |
2 |
0 |
1 |
0 |
88 |
| AUG |
0 |
0 |
0 |
2 | 3 | 4 | 5 | 6 | 6 | 7 | 7 | 7 | 7 | 7 | 7 | 6 | 6 | 5 |
0 |
0 |
0 |
0 |
1 |
0 |
86 |
| SEP |
0 |
0 |
0 |
0 |
0 |
4 | 5 | 6 | 6 | 7 | 7 | 7 | 7 | 7 |
7 |
6 |
6 |
0 |
0 |
0 |
0 |
2 |
0 |
0 |
77 |
| OCT |
0 |
0 |
0 |
0 |
0 |
4 | 5 | 6 | 6 | 7 | 7 | 8 | 8 | 7 |
0 |
0 |
0 |
5 |
0 |
0 |
2 |
0 |
0 |
0 |
65 |
| NOV |
0 |
0 |
0 |
0 |
0 |
4 | 5 | 6 | 7 | 7 | 7 | 8 | 8 | 7 |
0 |
0 |
0 |
0 |
0 |
3 |
0 |
0 |
0 |
0 |
62 |
| DEC |
0 |
0 |
0 |
0 |
0 |
4 | 5 | 6 | 7 | 7 | 8 | 8 | 8 |
8 |
0 |
0 |
0 |
0 |
0 |
3 |
0 |
0 |
0 |
0 |
64 |
How to estimate system size
The size, or capacity, of a solar electric system depends on how much electricity you intend to offset (energy demand), your local solar resource (peak sun hours), and the system’s overall efficiency (derate factor) among other factors. While a solar consultant or installer can provide a detailed and thorough analysis for system design, you can follow the calculation procedure that’s explained in this document, or use the worksheet in Appendix B, to estimate the size and output a solar PV array that meets your needs.
System Capacity
Steps 1: Determine your annual energy demand by reviewing the first section of this fact sheet. This energy demand will be based on either an itemized loads list or your electric utility history. You may need to convert your daily or monthly energy demand into an annual energy demand to complete this step.
Step 2: Calculate your desired solar energy production by considering what percentage of your energy demand you would like to offset with solar. System capacity can be designed to meet all or a percentage of your electrical demand. A solar offset of 1, for example, would offset all (or 100%) of your electrical demand. A smaller system could be designed by offsetting only a portion of the energy demand. A solar offset of 0.5, for example, would offset half (or 50%) of the energy demand. Once you decide on your solar offset, multiply the solar offset (in decimal form) by your energy demand.
Step 3: Determine system power, under ideal conditions, by dividing your desired solar energy production by the annual Peak Sun Hours (PSH) for your location (revisit the previous section for more information on how to assess your solar resource). You may need to convert the daily PSH into annual PSH to complete this step.
Step 4: Divide the ideal system power by a system derate factor to account for any system inefficiencies. Losses represented by this number include the impacts of shading, snow cover, wiring, connections, light induced degradation, nameplate rating, system age, and operational availability among other factors. A default value of 86% (or 0.86 in decimal form) is commonly used (Dobos, 2014), but site-specific conditions and equipment will cause variations. The above steps are summarized in the formula below.
System Capacity [kW] = Energy Demand [kWh/year] /Peak Sun Hours [hr/year] × Solar Offset [dec.] /derate factor [dec.]
Step 5: You can also estimate the number of solar panels needed to reach this system capacity. To do so, divide the system capacity by the nameplate wattage of the solar panel(s) that you intend to use. A conversion factor may be necessary (1 kW = 1,000 W) as indicated in the following formula. Other components of the PV system (e.g., inverters) can be sized in accordance with this system capacity. While other system-related factors will influence the system size, this procedure provides a rough estimate.
Number of Panels [#] = System Power [kW] × 1,000 [W/kW] ÷ Panel Power [W/Panel]
Computer Models
Online calculators and tools can also be used to estimate the monthly and annual energy production of a solar electric system, including the PVWatts calculator (NREL, 2023). Like other software options, PVWatts requires a user to input the site location, system specifications, siting details, and electric utility rates. The ‘Draw Your System’ feature can also be used to outline the physical area for the PV system and see the estimated capacity of the roof or field. In the following example (Figure 11), UMD’s Western Research and Education Center has been selected as the site of interest.
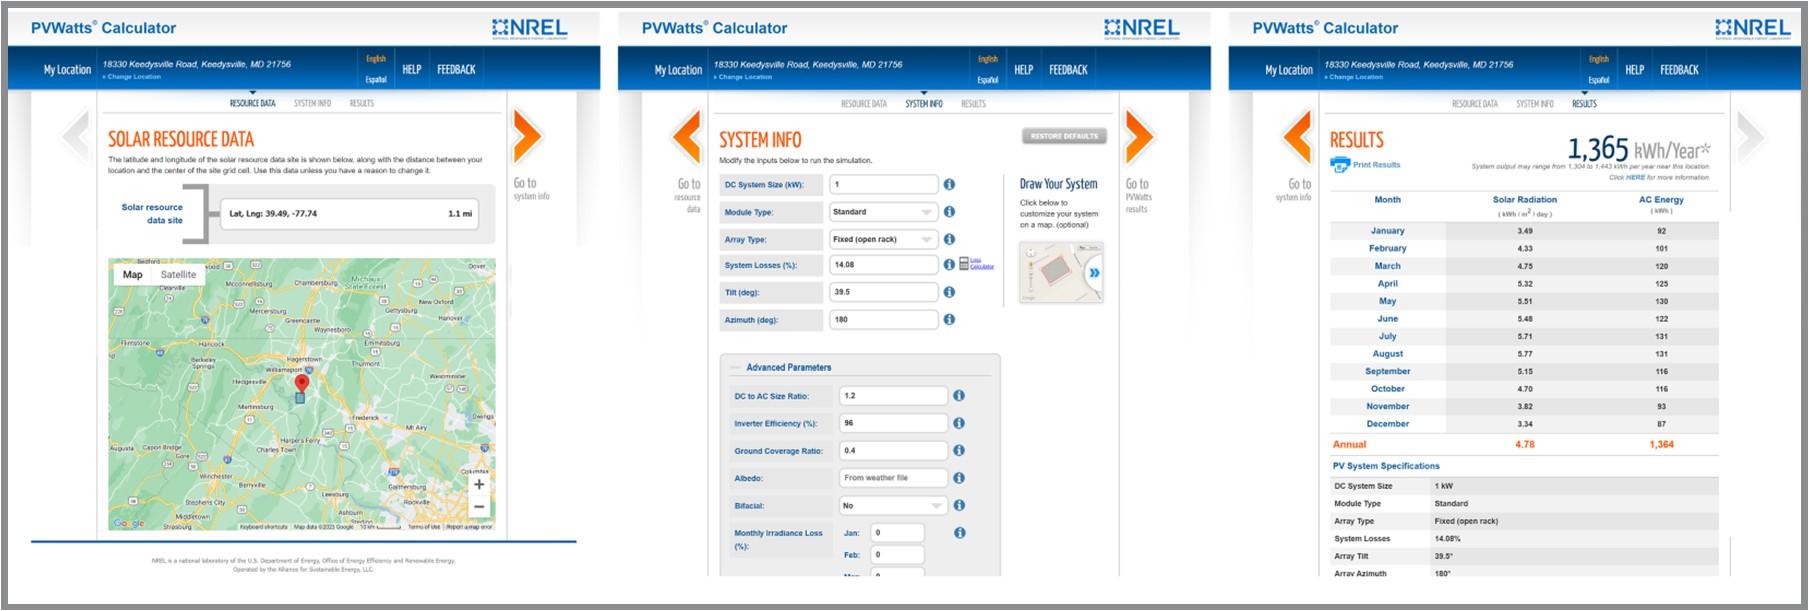
Be sure to review and confirm the software’s suggested weather station(s) before proceeding. In this case, the DC system size is set to 1 kW, while the fixed-open rack option is selected for a ground-mount system. The tilt angle has been set at the site’s latitude (39.5°), but the default values for all other parameters were accepted as is. PVWatts provides solar radiation data (which can be used in the calculation procedure presented in this report) and specifies an output of 1,365 kWh per year for this example, along with a month-by-month estimate of the estimated electricity production (kWh). To determine the size of a PV system based on this output, you can divide your annual electricity demand (kWh/year) by this value of solar energy production (kWh/year) that has been estimated on a per kW basis.
Other Considerations
Multiple input data sources (e.g., weather files) can also be considered when using various modeling tools. PVWatts, for example, has several weather data sets in the vicinity of UMD’s Western Maryland Research and Education Center. Running predictions with data from nearby sites will help to estimate uncertainties and account for any variations in the local solar resource. Modeling tools, like the System Advisor Model (NREL, 2022), can also provide a quick estimate of system production and financing by integrating various data libraries (e.g., solar resource, weather, equipment data, project cost, and/or financing inputs). A more detailed assessment could also help you to account for unique factors including shading effects, equipment specifications, or system oversizing.
Conclusions
While this factsheet provides a brief overview of load assessments, panel siting, and system sizing, your particular design will be guided by your motivations, goals, and priorities. It should also be noted that the production estimates presented in this report do not account for many additional factors that are important in the design of a PV system. Additional considerations can further influence the design of your system, including your roof or lot size, any local regulations, system cost and payback, as well as the integration of other components. For this reason, you should work with a qualified professional to make final design decisions based on an assessment of the system location and using more detailed engineering design and financial analysis tools. However, a careful review of the topics presented in this factsheet will help you initiate an informed and knowledgeable discussion with a solar installer or other energy professional.
References
- COMAR 20.50.10. (2021). Net Metering. Available from http://mdrules.elaws.us/comar/20.50.10
- Dobos, A. P. (2014). PVWatts version 5 manual (No. NREL/TP-6A20-62641). National Renewable Energy Laboratory (NREL), Golden, CO (United States). https://www.nrel.gov/docs/fy14osti/62641.pdf
- Drury, E., Lopez, A., Denholm, P., & Margolis, R. (2014). Relative performance of tracking versus fixed tilt photovoltaic systems in the USA. Progress in Photovoltaics: Research and Applications, 22(12), 1302-1315.
- Dunlap, M. A., Marion, W., & Wilcox, S. (1994). Solar radiation data manual for flat-plate and concentrating collectors (No. NREL/TP-463-5607). National Renewable Energy Laboratory, Golden, CO (United States). Retrieved from https://www.nrel.gov/docs/legosti/old/5607.pdf
- EIA. (2022a). Annual Electric Power Industry Report (EIA-861). U.S. Energy Information Association. Washington, DC. Retrieved from https://www.eia.gov/electricity/data/eia861
- EIA. (2022b). Electricity Data Browser: Net Generation for all sectors, Maryland, monthly 2001-2021. U. S. Energy Information Administration. Washington, DC. Retrieved from https://www.eia.gov/electricity/data/browser
- EIA. (2023). Monthly Electric Power Industry Report (EIA-826). U.S. Energy Information Association. Washington, DC. Retrieved from https://www.eia.gov/electricity/data/eia861m
- Maryland Code, Public Utilities, § 7-306 (2021). Available from https://codes.findlaw.com/md/public-utilities/md-code-public-util-sect-7-306.html
- NASA. (2022). Prediction of Worldwide Energy Resource (POWER): Data Access Viewer Enhanced (DAVe) (Version beta 2.0.4) [Web app]. https://power.larc.nasa.gov
- NREL. (2022) System Advisor Model (Version 2022.11.21) [Web app]. https://sam.nrel.gov
- NREL. (2023). PVWatts Calculator (Version 8.1.0) [Web app]. https://pvwatts.nrel.gov
- Ong, S., Campbell, C., Denholm, P., Margolis, R., & Heath, G. (2013). Land-use requirements for solar power plants in the United States (No. NREL/TP-6A20-56290). National Renewable Energy Laboratory, Golden, CO (United States). http://www.nrel.gov/docs/fy13osti/56290.pdf
- Roberts, B. (2008). U.S. Photovoltaic Solar Resource: Flat Plate Tilted at Latitude (Poster). National Renewable Energy Lab, Golden, CO (United States). http://en.openei.org/wiki/File:NREL-National-PV-Poster.pdf
- SEIA. (2023). State Solar Spotlight: Maryland Solar. Solar Energy Industries Association. Washington, DC. (May 6, 2021). Available from https://www.seia.org/state-solar-policy/maryland-solar
- Solar Energy Local. (2023). Local Solar Energy Resources [Database]. https://www.solarenergylocal.com
- U.S. EPA. (2015). EnviroAtlas Interactive Map [Web app]. https://enviroatlas.epa.gov/enviroatlas
- UO Solar Radiation Monitoring Laboratory. (2022). Sun Path Chart Program [Web app]. http://solardat.uoregon.edu/SunChartProgram.html
Funding acknowledgement

This material is based upon work supported by the National Institute of Food and Agriculture, U.S. Department of Agriculture, through the Northeast Sustainable Agriculture Research and Education program under subaward # ENE20-165-34268
Appendix
| Electrical Device | Quantity (#) | Power, P (Watts, W) | Daily Use (hours/day) | Yearly Use (times/year) | Energy, Annual (Wh) | Convert | Energy, Annual (kWh) | ||||||
|---|---|---|---|---|---|---|---|---|---|---|---|---|---|
| Motor, Small | 1 | × | 1,150 | × | 0.25 | × | 160 | = | 46,000 | ÷ | 1,000 | = | 46 |
| LED Light Bulb | 10 | × | 30 | × | 5 | × | 360 | = | 540,000 | ÷ | 1,000 | = | 540 |
| TV, 48” (on) | 1 | × | 182 | × | 2 | × | 250 | = | 91,000 | ÷ | 1,000 | = | 91 |
| TV, 48” (standby) | 1 | × | 5 | × | 22 | × | 364 | = | 40,040 | ÷ | 1,000 | = | 40 |
| Dishwasher | 1 | × | 1,240 | × | 1 | × | 100 | = | 124,000 | ÷ | 1,000 | = | 124 |
| Ventilation Fan | 1 | × | 940 | × | 4 | × | 350 | = | 1,316,000 | ÷ | 1,000 | = | 1,316 |
| Example Total | 2,157 |
| Electrical Device | Quantity (#) | Power, P (Watts, W) | Daily Use (hours/day) | Yearly Use (times/year) | Energy, Annual (Wh) | Convert | Energy, Annual (kWh) | ||||||
|---|---|---|---|---|---|---|---|---|---|---|---|---|---|
| × | × | × | = | ÷ | 1,000 | = | |||||||
| × | × | × | = | ÷ | 1,000 | = | |||||||
| × | × | × | = | ÷ | 1,000 | = | |||||||
| × | × | × | = | ÷ | 1,000 | = | |||||||
| × | × | × | = | ÷ | 1,000 | = | |||||||
| × | × | × | = | ÷ | 1,000 | = | |||||||
| Total |
Note: Record the number, and power rating (W), of all electrical devices/appliances. Power may be listed on the appliance’s data label or can be calculated as a product of the appliance’s voltage (V) and current (A). Most U.S. appliances use 120 volts, while larger appliances may use 240 volts. Estimate the number of hours per day, and the number of times per year, that the device/appliance will be powered. Divide by a factor of 1,000 to convert from watt-hours (Wh) to kilowatt-hours (kWh).
| #1 | Determine the average amount of electricity used in kilowatt-hours per year (kWh/year) based on a loads assessment list or your historic utility bills. A monthly average is used in the example, but you could also add your monthly totals. [Refer to the Load Assessment for more info] | 466 kWh/month × 12 Months = 5,592 kWh/year |
| #2 | Multiply your annual energy demand by the percent of electricity that you intend to provide from the sun. The example is performed for 50% (or 0.5 in decimal form). The result represents your desired solar energy production. [Refer to the System Capacity for more info] | 5,592 kWh/year × 0.50 = 2,796 kWh/year |
| #3 | Divide the desired solar energy production by average annual peak sun hours (PSH) for location nearest you. PSH are at peak intensity, not total daylight hours. You may need to convert daily PSH to yearly PSH by multiplying by 365 days. [Refer to the Solar Resource for more info] | 2,796 kWh/year ÷ 1,580 hrs/year = 1,770 kW |
| #4a | Divide the rough estimate of system capacity by a derate factor to account for any system inefficiencies. While the industry-average of 86% is assumed for the example, site-specific conditions and equipment will cause variations. [Refer to the System Capacity for more info] | 1,770 kW ÷ 0.86 = 2,058 kW |
| #4b | Multiply by 1,000 to convert the size of the overall system in kilowatts (kW) to watts (W). This system capacity can be used to approximate system cost and estimate the balance of system components. [Refer to the System Capacity for more info] | 2,058 kW × 1,000 W/kW = 2,058 W |
| #5 | Divide by the power rating (W) of the PV panel you intend to install. Round the number of PV panels to a whole number. Round up to ensure enough electricity is produced based on the selected criteria. [Refer to the System Capacity for more info] | 2,058 W ÷ W/panel = 5.7 panels |
| #1 | Determine the average amount of electricity used in kilowatt-hours per year (kW/year) based on a loads assessment list or your historic utility bills. A monthly average is used in the example, but you could also add your monthly totals. [Refer to the Load Assessment for more info] | ______ kWh/month × 12 Months = ______ kWh/year |
| #2 | Multiply your annual energy demand by the percent of electricity that you intend to provide from the sun. The example is performed for 50% (or 0.5 in decimal form). The result represents your desired solar energy production. [Refer to the System Capacity for more info] | ______ kWh/year × ______ = ______ kWh/year |
| #3 | Divide the desired solar energy production by average annual peak sun hours (PSH) for location nearest you. PSH are at peak intensity, not total daylight hours. You may need to convert daily PSH to yearly PSH by multiplying by 365 days. [Refer to the Solar Resource for more info] | ______ kWh/year ÷ ______ hrs/year = ______kW |
| #4a | Divide the rough estimate of system capacity by a derate factor to account for any system inefficiencies. While the industry-average of 86% is assumed for the example, site-specific conditions and equipment will cause variations. [Refer to the System Capacity for more info] | ______kW ÷ ______ = ______ kW |
| #4b | Multiply by 1,000 to convert the size of the overall system in kilowatts (kW) to watts (W). This system capacity can be used to approximate system cost and estimate the balance of system components. [Refer to the System Capacity for more info] | ______ kW × 1,000 W/kW = ______ W |
| #5 | Divide by the power rating (W) of the PV panel you intend to install. Round the number of PV panels to a whole number. Round up to ensure enough electricity is produced based on the selected criteria. [Refer to the System Capacity for more info] | ______ W ÷ ______W/panel = ______ panels |
Note: Refer to System Capacity for more information on this procedure and the calculations.
All images by the author
DREW SCHIAVONE, PH.D.
dschiavo@umd.edu
This publication, Working on Solar Design and System Sizing (FS-2023-0655) is a part of a collection produced by the University of Maryland Extension within the College of Agriculture and Natural Resources.
The information presented has met UME peer-review standards, including internal and external technical review. For help accessing this or any UME publication contact: itaccessibility@umd.edu
For more information on this and other topics, visit the University of Maryland Extension website at extension.umd.edu
University programs, activities, and facilities are available to all without regard to race, color, sex, gender identity or expression, sexual orientation, marital status, age, national origin, political affiliation, physical or mental disability, religion, protected veteran status, genetic information, personal appearance, or any other legally protected class.
Related Resources
-
Solar Module Guide >
Solar Module Guide > -
Working on Solar Panels and Power Output (FS-2022-0646) >
Working on Solar Panels and Power Output (FS-2022-0646) > -
Working on Solar Wiring and Fusing (EB-2023-0676) >
Working on Solar Wiring and Fusing (EB-2023-0676) >