FS-2025-0780 | February 2026
University of Maryland Extension Winter Meeting Data 2025
Dr. Shannon Dill, Extension Educator, Dr. Sarah Hirsh, Extension Educator, Dr. Kurt Vollmer, Extension Specialist, Dr. Nicole Fiorellino, UMD Agronomist, Extension Specialist, Andrew Kness, Extension Educator, and Macy Cook, 2025 Extension Intern
Introduction
The University of Maryland Extension (UME) Agriculture and Food Systems team organizes annual winter agriculture production meetings, providing a platform for education and networking. These sessions cover a diverse range of topics, including agronomy, vegetable production, forage management, and urban farming systems, while also offering opportunities for pesticide and nutrient management recertification.
The primary goal of these meetings is to deliver the latest research and innovative practices to support agricultural advancements. Audiences range from new and beginning farmers to long-time farm families, reaching over 600 participants. Attendees also include representatives from service industries, government, nonprofits, and private businesses, fostering collaboration and offering industry updates.
The Agriculture and Food Systems team uses surveys to collect demographic, production, and economic data to measure the outcomes of these efforts. These insights ensure the educational content remains relevant and effective, highlighting the program’s importance in advancing agricultural knowledge and practices across diverse audiences.
Winter Meetings
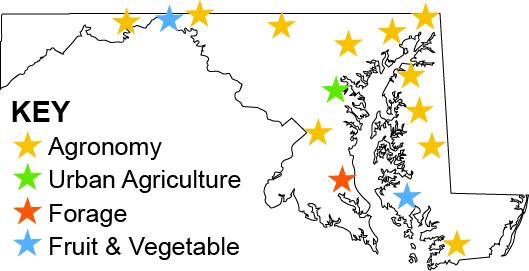
UME educators conducted 15 meetings between December 2024 and March 2025. The meetings are strategically located around the state to reach the intended audience of farmers (see Figure 1 and Table 1). Eleven educational meetings focused on agronomy, two on vegetable production, one on forage and hay production, and one on urban farming.
UME educators provided a consent statement to participants before distributing the IRB-approved survey. The consent statement explained the reason for the survey, contained a privacy notice, and offered the ability to opt out. The survey was conducted in person at the meetings and delivered on paper. Completed surveys were then collected and the responses were entered into Qualtrics survey software. Qualtrics provided results in percentages, means, and counts to facilitate data analysis. No additional statistical analysis was conducted beyond descriptive statistics. A total of 407 participants completed all or part of the survey.
| Meeting Type | Meeting Date | Meeting Title |
|---|---|---|
| Agronomy | December 4, 2024 | Washington County Agronomy Day |
| Agronomy | December 5, 2024 | Northern MD Fields Crops Day |
| Agronomy | December 11, 2024 | Kent County Agronomy Breakfast |
| Agronomy | December 12, 2024 | Southern Maryland Crop Conference |
| Agronomy | January 9, 2025 | Carroll County Mid-Winter Meeting |
| Agronomy | January 22, 2025 | Lower Shore Agronomy Day |
| Agronomy | February 6, 2025 | Cecil County Winter Agronomy Meeting |
| Agronomy | February 11, 2025 | Harford County Mid-Winter Agronomy Meeting |
| Agronomy | February 19, 2025 | Central Maryland Agronomy Meeting |
| Agronomy | February 20, 2025 | Mid-Shore Agronomy Day |
| Agronomy | February 28, 2025 | Queen Anne’s County Agronomy Meeting |
| Urban Agriculture | March 23, 2025 | Urban Farmer Winter Meeting |
| Forage | January 21, 2025 | Southern Maryland Forage Conference |
| Fruit and Vegetable | February 13, 2025 | Western Maryland Regional Fruit Meeting |
| Fruit and Vegetable | February18, 2025 | Eastern Shore Vegetable Grower Meeting |
Winter Meeting Results
The 2024-2025 winter meetings held by UME drew participants from 21 Maryland counties, Baltimore City, and from outside the state. These meetings aim to enhance yields and profitability by keeping farmers and agricultural service providers informed about relevant regulations and best practices. The purpose of the surveys was to discover the following:
- Demographics of those attending the workshops
- Identify current farming challenges and the effectiveness of extension programs in meeting participants’ needs
- Determine participants’ motivation, interest, and use related to annual implementation report completion and nutrient management plans
Farmer and Farm Information Results
Goal: Record Demographics of Those Attending the Workshops
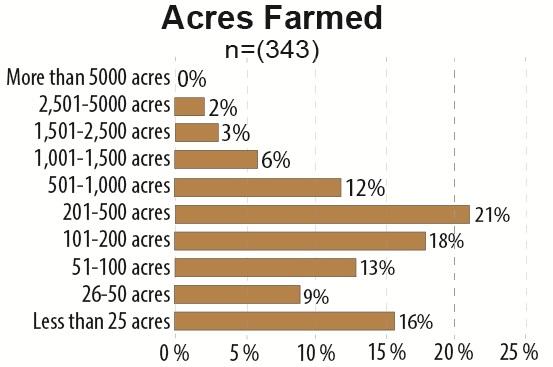
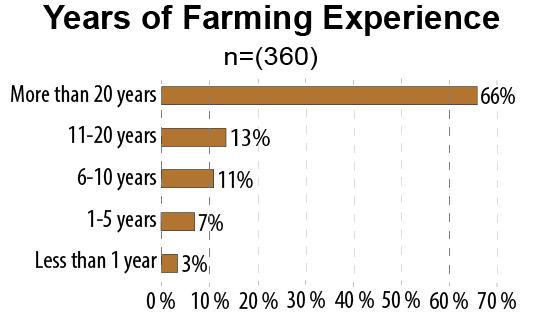
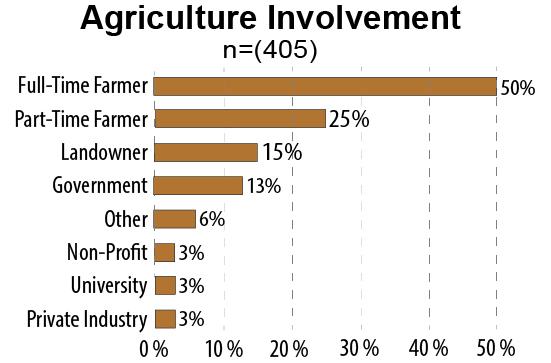
Survey participants, on average, farmed 430 acres (Figure 2), and 66% of participants have been farming for over 20 years (Figure 3). Most participants were full-time farmers (50%), followed by part-time farmers (25%), landowners (15%), and those involved with the government (13%) (Figure 4). A small percentage of participants were also engaged in agriculture through a university, private industry, or nonprofit organization.
Needs Assessment & Program Planning Results
Goal: Identify Current Farming Challenges and the Effectiveness of Extension Programs in Meeting Participants’ Needs
Participants were asked to select their most significant farm challenges from a list and could choose as many as they wished. The most selected challenges were input costs (65%), weather (47%), and wildlife damage (44%) (Table 2).
| Challenge | Percent |
|---|---|
| Input costs (n=249) | 65% |
| Weather (n=179) | 47% |
| Wildlife Damage (n=167) | 44% |
| Regulations (n=162) | 43% |
| Markets (n=135) | 35% |
| Pests and diseases (n=107) | 28% |
| Labor (n=99) | 26% |
| Loss of farmland (n=84) | 22% |
| Public perception (n=51) | 13% |
| Other (n=20) | 5% |
Participants who claimed “other” as their greatest challenge cited food safety, yields, and old age among their greatest farming challenges. Participants were asked to indicate how much they relied on UMD Extension for various research and education topics. For each research and education topic listed, participants could check that they relied “none at all,” “a little,” “neutral,” “a lot,” or “the most.” The majority of participants indicated that they relied “a lot” to “the most” on UMD Extension for research and education on pesticide training and recommendations (71%), research and data information (68%), regulatory information (68%), and nutrient management planning and recommendations (65%) (Table 3).
| Research & Education Topics | Percent that rely “a lot” to “the most” on UMD Extension for research and education on the topic |
|---|---|
| Pesticide Training & Recommendations (n=265) | 71% |
| Research & Data Information (n=250) | 68% |
| Regulatory Information (n=251) | 68% |
| Nutrient Management Planning & Recommendations (n=239) | 65% |
| Crop Production Information (n=183) | 50% |
| Agriculture Business Management (n=116) | 32% |
Participants were asked to indicate how effective they find the current extension programs in meeting their needs. Participants could choose whether they find current extension programs to be “not effective,” “somewhat effective,” “neutral,” “effective,” or “very effective” in meeting their needs. The majority of participants indicated that current extension programs are “effective” (48%) or “very effective” (24%) (Table 4).
| Effectiveness | Percent |
|---|---|
| Very Effective (n=80) | 24% |
| Effective (n=160) | 48% |
| Neutral (n=59) | 18% |
| Somewhat Effective (n=29) | 9% |
| Not Effective (n=7) | 2% |
Participants were asked to identify which areas of extension programming are the most valuable to their operations. Participants cited nutrient management (66%), regulatory information (55%), and pest management (54%) as the three most valuable areas of extension programming (Table 5).
| Extension Programming Area | Percent that found each area most helpful |
|---|---|
| Nutrient Management (n=236) | 66% |
| Regulatory Information (n=197) | 55% |
| Pest Management (n=194) | 54% |
| Agriculture Education & Promotion (n=153) | 43% |
| Conservation Practices (n=141) | 39% |
| Agronomic Production (n=94) | 26% |
| Fruit & Vegetable Production (n=81) | 23% |
| Livestock Management (n=80) | 22% |
| Marketing (n=64) | 18% |
| Financial Management (n=52) | 14% |
*As participants could select more than one, the total is more than 100%.
Participants were asked to choose which new and emerging markets they would like assistance in exploring. The majority of participants cited “Alternative Crops” (53%) as an area they would like assistance in exploring, followed by “Carbon Credits” (28%) and “Value-Added Grain Processing” (25%) (Table 6). Producers who chose the market option of “Other” cited “Value-Added Products” and “Regenerative Practices” among additional markets they would like assistance exploring.
| Market | Percent of Producers That Would Like Assistance Exploring This Market |
|---|---|
| Alternative Crops (n=143) | 53% |
| Carbon Credits (n=75) | 28% |
| Value-Added Grain Processing (n=68) | 25% |
| Local Food Systems (n=65) | 24% |
| Renewable Energy (n=63) | 23% |
| Organic Production (n=35) | 13% |
| Other (n=16) | 6% |
*As participants could select more than one, the total is more than 100%.
Opened Ended Questions
Participants were asked to list additional support or resources from the University of Maryland Extension Agriculture and Food Systems Team that would provide help to their farms. Themes included:
- Education & Training
Respondents requested more hands-on, practical trainings, including topics like food safety, pest control, regenerative farming, organic wine production, precision ag, and enterprise budgeting. - Urban Agriculture & Community Engagement
Support is needed for urban growers, vulnerable populations, and community-led efforts, especially in areas like Baltimore City. Suggestions included better outreach and sustained support for local meetings and events. - Resources & Technical Assistance
Requests included help with soil sampling, wildlife and forest management, grants, marketing, and improving systems like the AIR submission process. - Communication & Access
Respondents emphasized the need for improved outreach (e.g., printed newsletters) and encouraged stronger youth engagement in agriculture and Extension. - General Feedback
Many shared their appreciation for Extension’s responsiveness and expertise. A few noted being overwhelmed by learning about new problems without immediate solutions.
Nutrient Management Program Support Results
Goal: Determine Participants’ Motivations, Interests, and Reliances Related to Annual Implementation Report Completion & Nutrient Management Plans
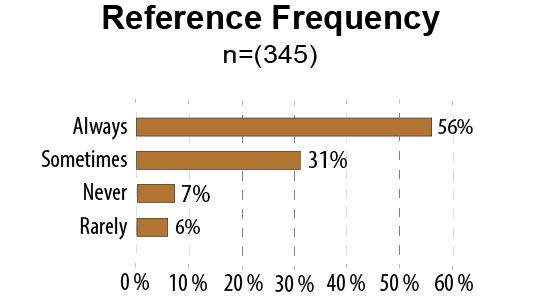
Participants were asked how often they refer to their nutrient management plan when making fertility decisions. 87% of participants stated they “Always” or “Sometimes” referred to their nutrient management plan when making fertility decisions (Figure 5).
Participants were asked about their interest in learning how to write their own nutrient management plan. The majority of participants did not have an interest in learning this skill, with 64% saying they were either “not interested at all” or had “low interest” in learning (Table 7).
| Interest Level | Percent |
|---|---|
| Not at all interested (n=126) | 36% |
| Low interest (n=98) | 28% |
| Moderate Interest (n=76) | 22% |
| Very interested (n=49) | 14% |
Participants were asked how important it was for them to have control over their nutrient management plan. 81% of participants cited that it was “very important” or “moderately important” to have control over their nutrient management plan (Table 8).
| Interest Level | Percent |
|---|---|
| Very Important (n=145) | 42% |
| Moderately Important (n=135) | 39% |
| Low Importance (n=45) | 13% |
| Not at all important (n=22) | 6% |
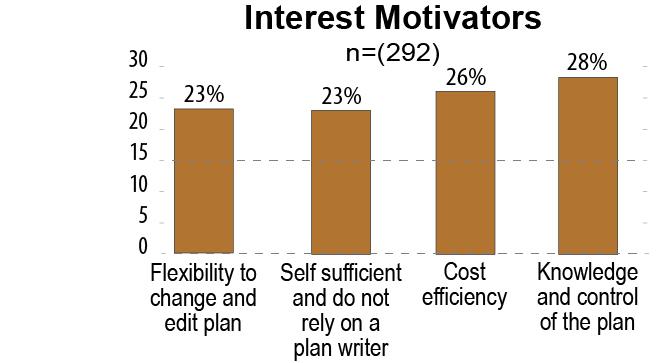
Participants were asked what factors would motivate their interest in creating their own nutrient management plan. Factors included “cost efficiency,” “knowledge and control of the plan,” “flexibility to change and edit the plan,” and “self-sufficient and do not rely on a plan writer.” The greatest interest motivator was to have “knowledge and control of the plan” (28%), followed by “cost efficiency” (26%) (Figure 6).
Participants were asked to identify the challenges they face when completing their annual implementation reports. The largest cited challenge was “gathering the necessary data” (34%), while “no challenges” (32%) were cited second (Table 9). Participants who chose “other” cited “finding a sample plan” and “learning how to do the calculations” as challenges they face when completing their reports.
| Challenges | Percent |
|---|---|
| Gathering the necessary data (n=111) | 34% |
| No challenges (n=103) | 32% |
| Understanding the requirements (n=89) | 28% |
| Difficulty using online reporting systems (n=61) | 19% |
| Limited time (n=60) | 19% |
| Other (n=25) | 8% |
*As participants could select more than one, the total is more than 100%.
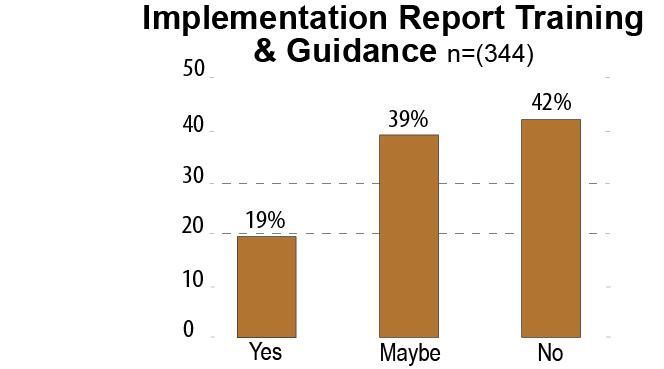
Participants were asked if they would like training or guidance in completing their annual implementation reports. The majority of participants responded that they do not want training or guidance (42%), while only 19% responded that they would like training or guidance (Figure 7).
Open-Ended Question on Nutrient Management Reporting
Participants were given the opportunity to provide suggestions for improving the process of completing annual implementation reports. Many of the responses were related to the desire for readily available templates, samples, examples, or resources, as well as a longer time frame and a later due date for the report. A summary of themes includes:
- Simplify the Process - Many requested clearer instructions, examples, and more user-friendly forms—ideally with “check-the-box” options and simpler language.
- Provide Tracking Tools - Respondents suggested templates and tools to help track information throughout the year and avoid errors, especially for calculations and conversions.
- Improve Format & Access - There was interest in both paper and online options, with a preference for a unified format that works for different user needs.
- Adjust Timing - Several requested deadline extensions to align with tax season or lengthen plan terms from 4 to 5–7 years.
- Offer More Support - Respondents valued one-on-one help, online guidance, and continued assistance from UMD Extension staff.
- Address Frustration - Some expressed concern over regulatory burden and called for major revisions or elimination of certain requirements.
Open-Ended Questions
Participants could provide additional comments and feedback about the event. Many of the comments were related to the presentation topics and formats, and the educational information shared at the event. Selected quotes about the days include:
- "This was a very good meeting with relevant topics.”
- “Great informative source”
Conclusion
The University of Maryland Extension (UME) 2024-25 Winter Agriculture Production Meetings successfully provided updates and practical solutions to Maryland’s agricultural community. Reaching over 600 participants from diverse agricultural sectors, the survey results highlighted the program’s impact, demonstrating its role in enhancing agricultural knowledge and practices that lead to the profitability and viability of this important sector. These winter meetings remain a cornerstone of UME’s mission to support Maryland agriculture, driving innovation and sustainability while fostering collaboration across the farming community. Future iterations will continue leveraging feedback and data to address emerging challenges and advance agricultural success.
SHANNON DILL
sdill@umd.edu
SARAH HIRSH
shirsh@umd.edu
KURT VOLLMER
kvollmer@umd.edu
NICOLE FIORELLINO
nfiorell@umd.edu
ANDREW KNESS
akness@umd.edu
MACY COOK
mcook425@umd.edu
This publication, University of Maryland Extension Winter Meeting Data 2025 (FS-2025-0780, is a part of a collection produced by the University of Maryland Extension within the College of Agriculture and Natural Resources.
The information presented has met UME peer-review standards, including internal and external technical review. For help accessing this or any UME publication contact: itaccessibility@umd.edu
For more information on this and other topics, visit the University of Maryland Extension website at extension.umd.edu
University programs, activities, and facilities are available to all without regard to race, color, sex, gender identity or expression, sexual orientation, marital status, age, national origin, political affiliation, physical or mental disability, religion, protected veteran status, genetic information, personal appearance, or any other legally protected class.
When citing this publication, please use the suggested format:
Dill, S., Hirsh, S., Vollmer, K., Fiorellino, N., Kness, A., & Cook, M. (2026). University of Maryland Extension Winter Meeting Data 2025 (FS-2025-0780). University of Maryland Extension. go.umd.edu/FS-2025-0780
-
Back to Program Impact >
Back to Program Impact > -
2020-2021 Virtual Winter Meetings >
2020-2021 Virtual Winter Meetings > -
University of Maryland Extension Winter Meeting Data 2022 (FS-2022-0642) >
University of Maryland Extension Winter Meeting Data 2022 (FS-2022-0642) > -
University of Maryland Extension Winter Meeting Data 2023 (FS-2024-0731) >
University of Maryland Extension Winter Meeting Data 2023 (FS-2024-0731) > -
University of Maryland Extension Winter Meeting Data 2023-2024 (FS-2024-0744) >
University of Maryland Extension Winter Meeting Data 2023-2024 (FS-2024-0744) >