
FS-1180 | September 2021
How Can Growers Determine Apple Fruit Maturity and Optimal Harvest Dates?
Whether apples will be sold for immediate fresh market consumption, stored for wholesale under regular or controlled atmosphere storage, or sold for processing, estimating optimum harvest dates is critical for scheduling labor, and ensuring a high-quality product.

Fruit harvested too early will have insufficient red skin coloration, low sugar content (soluble solids), and high acidity levels. The fruit also will be small, too firm, lacking flavor, and susceptible to physiological disorders such as bitter pit or storage scalds. Fruit harvested too late will be overripe, leading to off-flavor, softening, susceptibility to damage and pathogens, short postharvest life, and increased potential for physiological disorders.
Growers can determine apple harvest maturity and optimal harvest dates using different maturity indices, including changes in background and surface color, fruit firmness, starch content, soluble solids content, acidity levels, and fruit taste. A good strategy is to use several indices to make harvest and storage decisions, especially under unusual weather conditions. No single maturity index alone can explain true maturity and the values of each maturity index can differ from year to year.
Cultivar/strain, orchard block, and the fruit’s target market will determine the appropriate maturity indicators and value ranges to use. The maturity indices will vary for each cultivar/strain and orchard block, so it is important to collect representative samples from each to conduct the maturity tests. Start monitoring fruits weekly around 4 to 5 weeks before the anticipated normal harvest date. Careful observation of the results and trends in each cultivar/strain and orchard block will help you identify the best indices to use for determining optimal fruit harvest dates. This report describes several tests to determine apple fruit maturity. Before performing any measurements, however, the first step is to know how to collect a representative fruit sample from the orchard block.
Fruit Maturity Varies Within Same Orchard Block and Within Same Tree
The first step in collecting a representative sample is to select five to eight trees in each block of cultivar/strain and rootstock. The crop load and vigor of the selected trees should be representative of the rest of the trees in the same block. Avoid choosing trees located in the borders of any block. Mark the chosen trees so you can collect weekly samples.
Begin collecting samples around 4 to 5 weeks before the anticipated normal harvest date. Use days after full bloom (DAFB) to estimate anticipated harvest dates. To determine the DAFB, record the data of full bloom by orchard block and cultivar/strain in the spring. Do this yearly because full bloom may vary annually and within different areas in your orchard. DAFB is only a general indicator of when fruit will reach maturity. There might be 5 to 20 days between the estimated and optimal harvest dates for a specific cultivar/strain.
Sample once per week initially but increase sampling to 2-3 days per week as the fruit matures. Select two or three fruit from the periphery of each marked tree because these fruit tend to ripen earlier than those in the inner part of the canopy. Avoid fruit with any visible disease or insect damage, make sure to choose the same-sized fruit, and use a consistent sampling method (select fruit from both sides of the tree and same canopy height). Collect your samples at the same time of the day.
Measure your samples within 2 hours after picking, as temperature changes can affect results.
Physicochemical Changes Occur as Apples Ripen
Ripening apples have decreased chlorophyll, increased red skin coloration, darker seeds, greater fruit respiration and ethylene production, less acidity, and softer flesh. Starch in the flesh is converted to sugars and fruit taste also changes. Most of these changes can be easily quantified using different maturity tests. The exception is measuring ethylene production rates which need to be quantified using a lab-based gas chromatograph, while taste can be perceived by biting into the fruit to ensure its palatability. The importance of each indicator is determined by the target market/consumer.
Color Changes
Fruit coloration requirements will differ depending on the cultivar/ strain (solid red, striped red, green or yellow). Changes in the surface color (part of the skin is colored red) and background (part of the skin is not colored red) are sometimes important maturity indices.
Surface color measurements:
For red-colored cultivars, the indicator for commercial grade is based on the percentage of the fruit surface with a good shade of red (more color, better grade). For example, in the case of Honeycrisp, the acceptable minimum color for the retail sector is 50-60% red with no hard green.
Background color:
Changes from green to yellow in the background color of apples can be a good indicator of fruit maturity. This is especially important for cultivars such as Gala and Fuji. In general, fruit destined for long-term storage should be harvested when the background color is changing from green to yellow. Fruit with background color changing from yellow to cream should be for short-term storage.
Chlorophyll’s content quantification using a DA (difference of absorbance) meter:
The DA meter measures the Index of Absorbance Difference (Iᴀᴅ) which relates to fruit greenness and thus to the content of chlorophyll-a in the fruit skin. The DA meter is a hand-held device that shines LED light into the apple and a sensor measures how much light reflects back. It can be used for fruit still attached to the tree, as well as detached fruits.
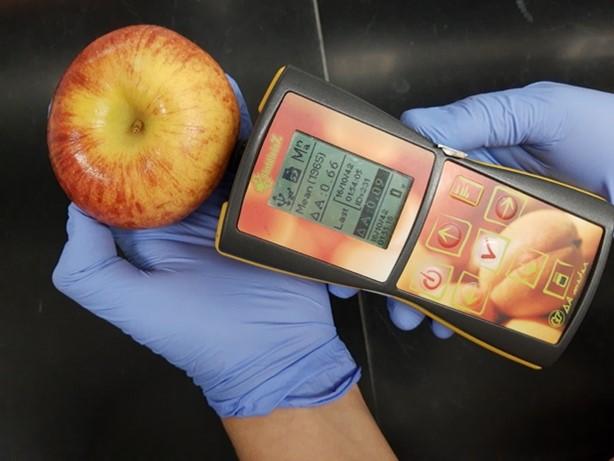
Values of Iᴀᴅ decrease as the fruit ripens and the chlorophyll degrades. For each apple cultivar, a characteristic DA index can be developed. In general, DA index readings of 0.60-0.70 are recommended for long-term storage apples, while 0.35 index values are targeted for harvesting fruit for short-term storage (Figure 1). It is important to highlight that DA readings need to be combined with other maturity indices to define the fruit ripening stage, and these general values can vary depending on orchards and years and should not be used to define fruit maturity independently.
Fruit Firmness Changes
As fruit matures and ripens, the flesh becomes softer. Fruit firmness/pressure testers or penetrometers measure these changes. The testers determine the amount of force required to puncture the flesh of the fruit (without skin). Some common brands include Effegi firmness tester and Magness-Taylor pressure tester.
To measure firmness in apples, use a firmness tester/penetrometer with a 7/16-inch diameter plunger, usually the larger of the two provided. Before testing, use a potato peeler to remove a nickel- to quarter-sized disk of skin on the blush and the non-blush sides of the apple. Take the sample from a point midway between the stem and blossom end, avoiding sunburned areas.

Hold the fruit against a stationary, hard surface and force the tip of the plunger into the exposed fruit flesh but not through the skin, to a depth of 7.9 mm (Figure 2). To get accurate readings, it is critical to adjust the speed at which the plunger tip penetrates the fruit flesh. It should take 2 seconds to push the plunger at a consistent speed. Applying pressure too fast can result in an inaccurate reading. Measure both sides and average the readings to determine the single fruit value. For consistency, the same person should perform the tests for each fruit lot.
Several factors can affect firmness readings. The presence of watercore (physiological disorder characterized by water-soaked areas of the apple’s cortex which cause the tissue to become translucent), for example, will give erroneous higher readings. Fruit size can also affect firmness readings because larger apples will usually be softer than smaller ones. For accurate measurements, select fruit homogenous in size and representative of the orchard block.
Because flesh firmness highly correlates with postharvest storage quality, firmness is a key aspect to measure for long-term storage fruit. Apples for long-term storage (>3 months) should be harvested with a firmness of at least 15 lbs. Firmness of 13-15 lbs. is appropriate for fruit for shorter-term storage (1-2 months).
Starch Content Changes
Starch in the fruit flesh is converted to sugars as apples mature and ripen. Determine the stage of maturity of apples by performing a simple starch-iodine test. As iodine binds to the starch molecules in the apple flesh, the cells turn blue-black. Cells containing sugars will have no color change. The starch content test records the degree of starch disappearance in the flesh since starch concentration decreases as the fruit matures and ripens.
You can purchase ready-to-use iodine solution or prepare it by mixing 10 grams of potassium iodide and 2.5 grams of iodine crystals in 1 liter of water; stir for several hours until the crystals completely dissolve. Keep the iodine solution in a well-labeled opaque container or wrap it with aluminum foil so it does not fade when exposed to light. The cap should be non-metallic since the iodine solution disintegrates metals. Avoid contact with the solution as it is highly poisonous! Always wear gloves to avoid skin contact and note that tested apples should not be used as compost or for animal feed.

To perform the starch-iodine test, cut an apple in half horizontally around its equator and apply iodine solution to the cut surface of one of the halves, holding the apple half by the stem. Drain any excess solution (Figure 3). Set treated side up and wait for 2 minutes for the solution to react with the apple flesh (under cold conditions, the reaction can take longer).
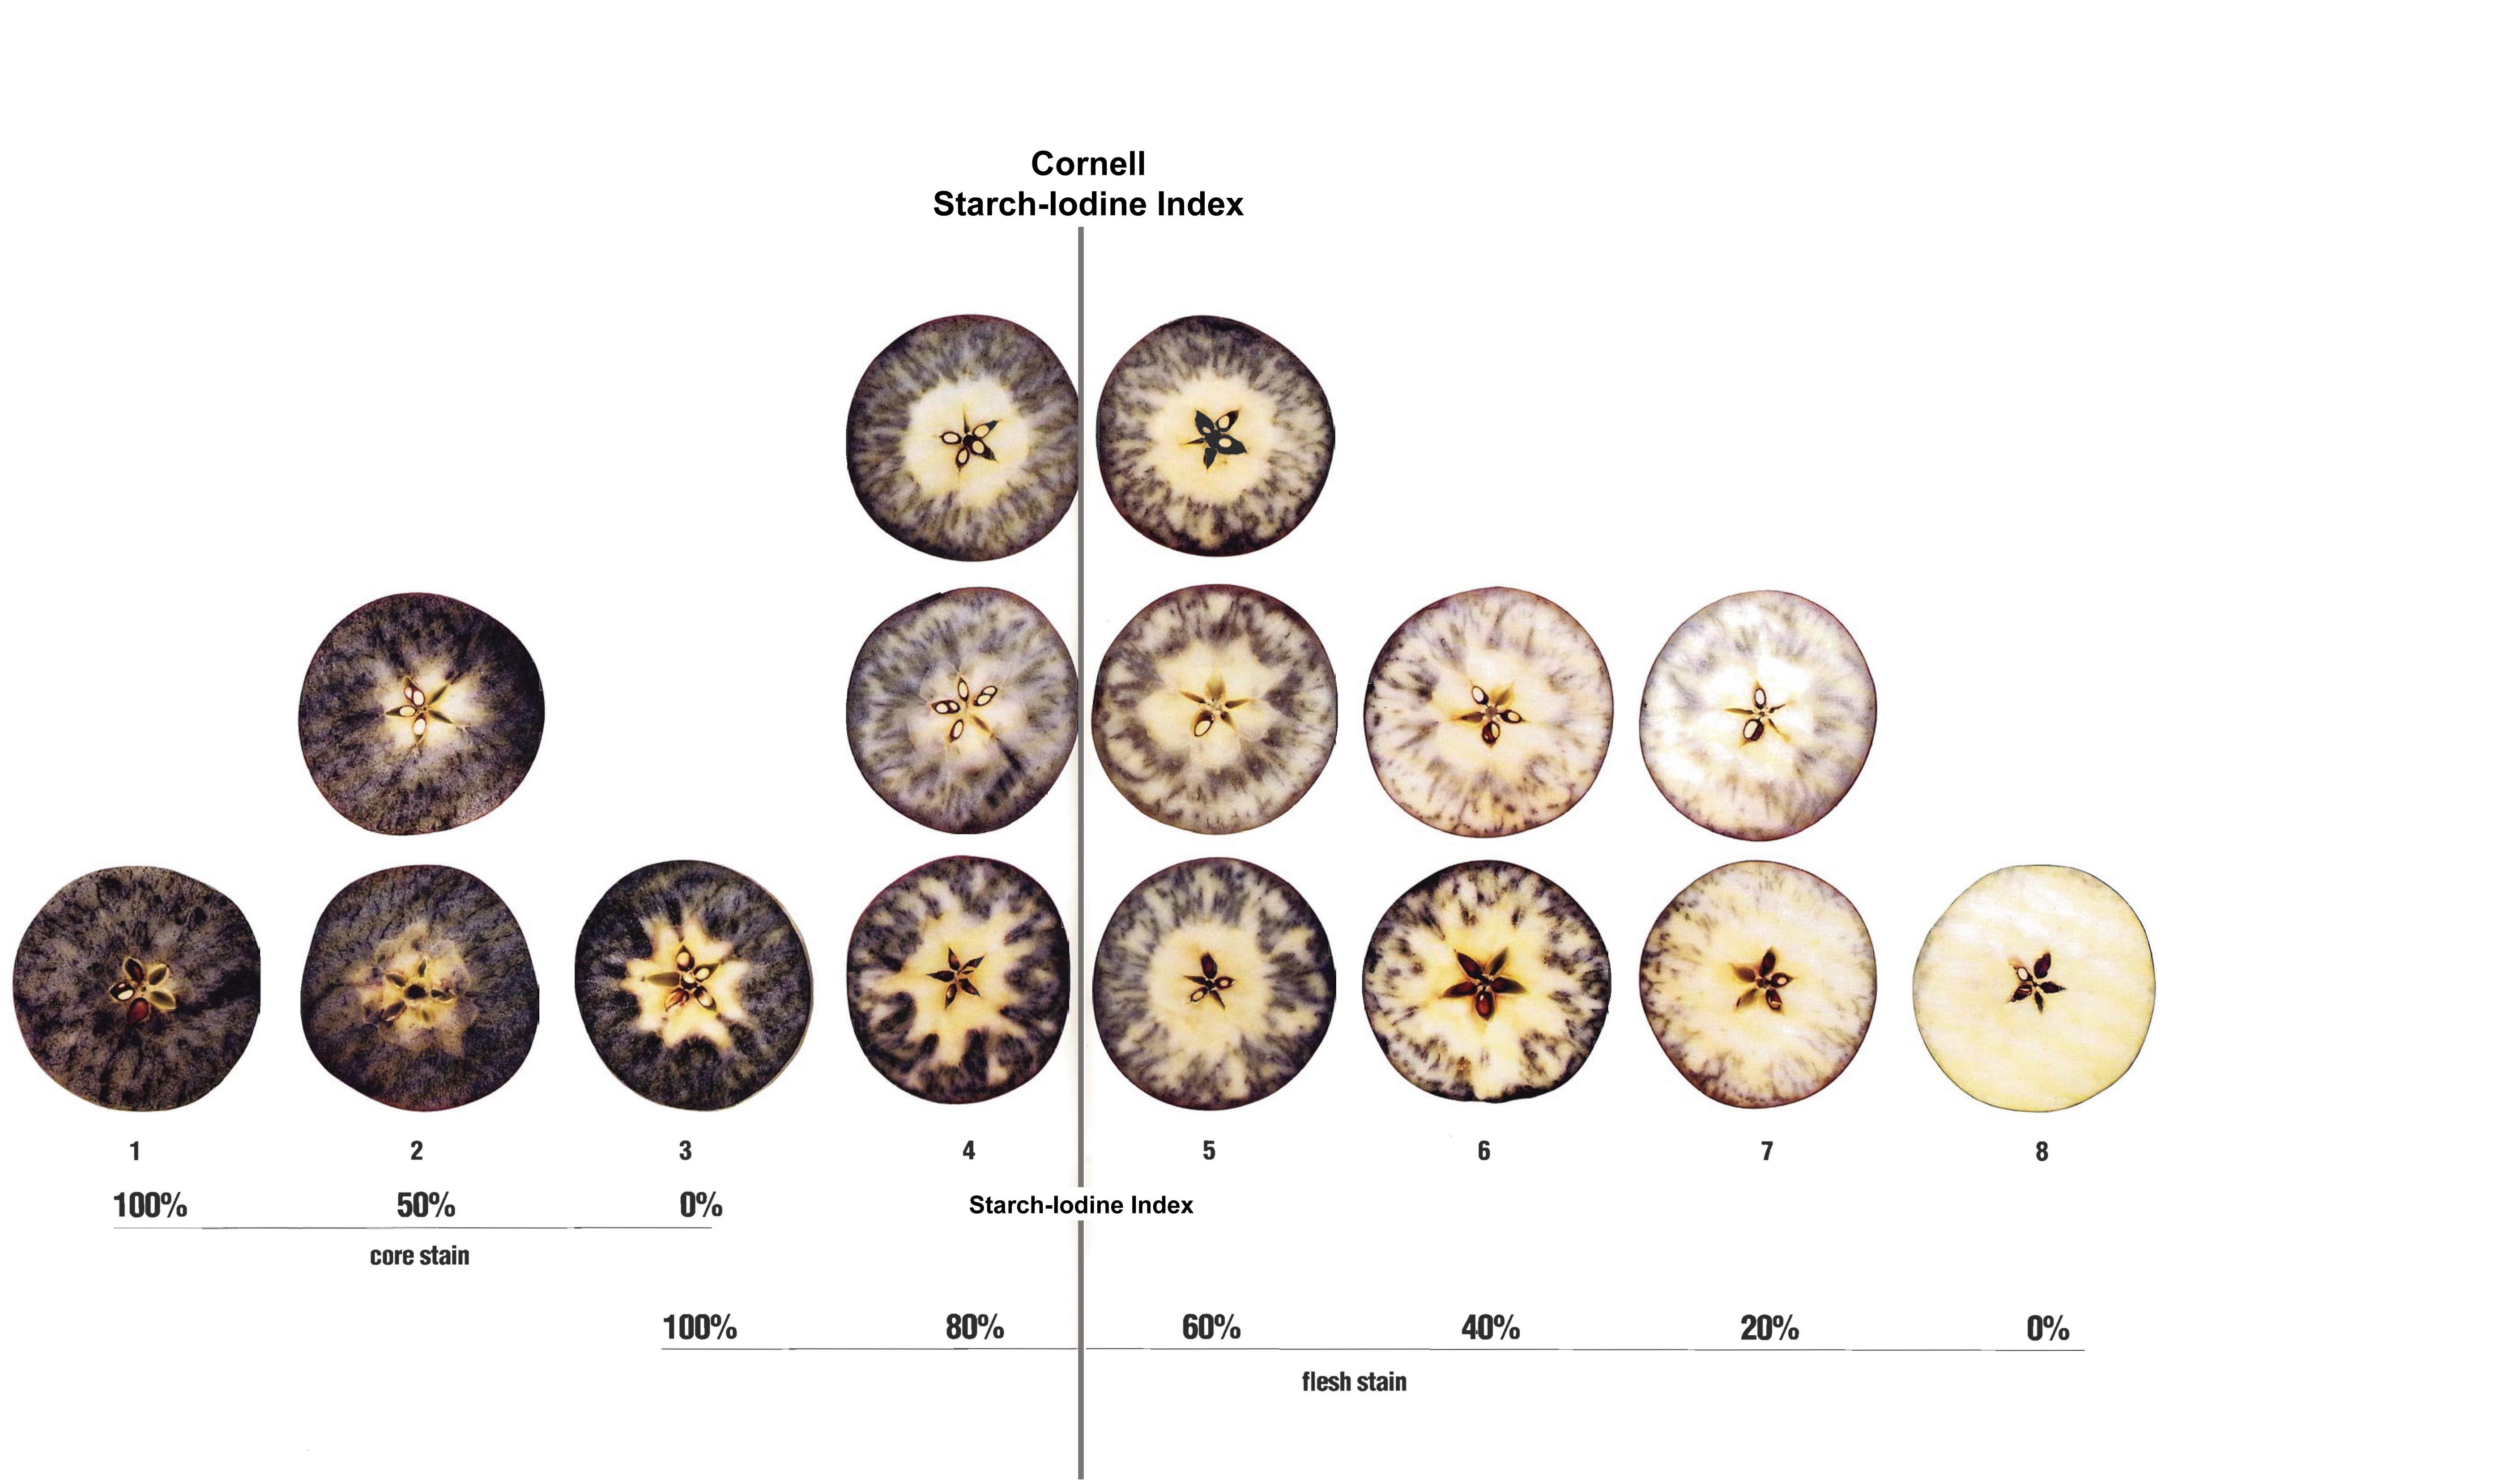
The pattern for starch disappearance is specific for each apple cultivar/strain. For example, Golden Delicious, Gala, Honeycrisp, and Fuji do not lose starch in a uniform pattern. Delicious apples lose starch in a moderately even ring. The common starch index rating system is scaled from 1 to 8 where 1 is full starch (all blue-black) and 8 is starch-free (no stain) (Figure 4). For Honeycrisp, a specific starch chart has been developed, which ranges from 1 to 6 (Figure 5).

Source: Washington State Tree Fruit Research Commission
The aim of the starch test is to compare the pattern of each stained apple-half with the pictures on the specific chart you are using, and to choose the picture which most closely represents what you are observing. Calculate the average to the nearest one-tenth of an index number.
Optimal harvest values for the starch test vary depending on the cultivar/strain and rating system used. In general, on a 1 to 8 scale, values ranging from 3-5 are recommended for harvesting apples for long-term storage, versus 6-7 for fresh market.
Soluble Solids Concentration (SSC) or Sugar Concentration Changes

The sugar concentration of apples increases as the fruit matures and ripens. Use a manual or digital refractometer to measure the percentage of soluble solids concentration (SSC) of an extracted fruit juice sample (Figure 6). The SSC measures sugars (mainly sucrose), organic acids, and inorganic salts. Soluble solids are simpler to measure than sugars. SSC works as an effective approximation of the percentage of sugar concentration in fruit juices.
To measure soluble solids, squeeze a small amount of juice into the device’s prism. Use the juice obtained as a by-product of the flesh firmness test, or use a garlic or potato press to squeeze juice from the apples. If you use a manual instrument, hold it up to the light and look through the lens to read the percentage of SSC from the scale. Digital refractometers have an internal light source and sensor that delivers the reading and are temperature-compensated; differences in temperature can affect the readings. After each juice sample, rinse the prism surface with distilled water and carefully wipe with a soft tissue to prevent contamination between samples. Calibrate the refractometer by zeroing with distilled water and then using a 10% sucrose solution.
Several factors can affect SSC readings which can make them highly variable and difficult to compare between seasons. SSC increases in fruit during years with high temperatures and more sunlight, due to increased photosynthesis. SSC decreases with excessive rain or irrigation and when there is a high crop load in the tree. Fruit on the same tree can vary in SSC content. Fruit located in heavily shaded areas or on weak spurs will have lower SSC values compared to fruit in sun-exposed areas.
As the fruit matures and ripens, SSC readings will increase. While harvesting apples with SSC readings around 12% to 14% is recommended, SSC targets will vary by cultivar/strain and target markets for the fruit.
Acidity Changes

The major acid present in the juice of apples is malic acid, and along with sugars and aroma volatiles, contributes to apple flavor. As fruit matures and ripens, total acid contents decrease. In general, apple acidity is not a frequently used maturity index because there are no recommended guidelines for maturity based on acid contents. Wide variation among cultivars in the rates at which fruit loses acidity and their optimal acidity contents for consumption make it challenging to develop such recommendations.
Acidity needs to be measured using specialized laboratory equipment, such as a titrator. Fruit acidity is measured by adding a base solution of sodium hydroxide to a juice sample in small amounts until the acids in the juice are neutralized. Handheld refractometer-type instruments measure both SSC and total acidity for apples (Figure 7).
A decrease in acidity indicates advancing maturity. Acidity measurements are most useful when made frequently on the same tree. Instead of defining a target acidity range for optimal harvest, it is more effective to use the rate of acidity changes to measure apple maturity. To develop acidity patterns and guidelines, record acidity contents over a number of harvests.
MACARENA FARCUH
mfarcuh@umd.edu
This publication, How Can Growers Determine Apple Fruit Maturity and Optimal Harvest Dates? (FS-1180) is a part of a collection produced by the University of Maryland Extension within the College of Agriculture and Natural Resources.
The information presented has met UME peer-review standards, including internal and external technical review. For help accessing this or any UME publication contact: itaccessibility@umd.edu
For more information on this and other topics, visit the University of Maryland Extension website at extension.umd.edu
University programs, activities, and facilities are available to all without regard to race, color, sex, gender identity or expression, sexual orientation, marital status, age, national origin, political affiliation, physical or mental disability, religion, protected veteran status, genetic information, personal appearance, or any other legally protected class.