Leachable Nutrients: Sulfur, Boron, and Nitrogen Fertility in Corn
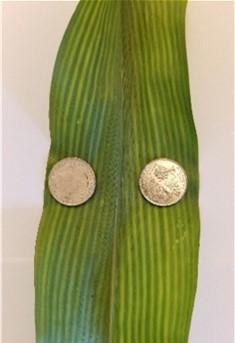
For a project sponsored by the Maryland Grain Producers, we looked at increasing applications of sulfur (S) and boron (B) on corn yields and nutrient uptake. As anions, S and B leach easily from the soil surface (particularly sandy loams), potentially leading to crop deficiencies. In the soil N is also commonly in an anion form (NO3), which may also leach easily, or compete for uptake with the anions S and B. Therefore, our question was whether the addition of S and/or B would also affect the uptake of N into corn.
Irrigated research plots (10 by 40 feet) were established in Georgetown, DE and fertilized as 1) starter and side-dress UAN, 2) N-sol starter and UAN side-dress, 3) N-sol starter and UAN + ammonium sulfate (AS) side-dress, 4) starter UAN and side-dress UAN+B, 5) N-sol starter and UAN side-dress + B side-dress, 6) N-sol starter and AS +B side-dress.
Results:
When compared by treatment, additions of S and/or B did not increase yield, which ranged from 246 to 252 bu/acre (Table 1). Although this field has exhibited S deficiencies in the past, there were no visible deficiencies present during this project. Following harvest, soil concentrations (0-8”) of NH4 and NO3 were higher in treatment 4, which only added 0.5 B with UAN at sidedress (Table 1). The steady addition of S in treatments 1-3 did appear to reduce NH4, but it was not significantly different. The addition of S did not significantly increase levels in the soil post-harvest, but both treatments with sidedressed AS had the highest remaining S values (Treatment 3 and 6). The addition of B increased soil levels in treatments 4 and 6, but not 5, without any immediate reason why. Higher remaining B in those two treatments may indicate low need by the corn crop.
|
Treatment |
Yield |
NH4 |
NO3 |
SO4 | B |
|---|---|---|---|---|---|
| starter+sidedress | bu/acre | --------------------------- ppm -------------------------- | |||
| 1 - (N + N) | 251.2 | 3.12 b | 7.11 ab | 13.4 | 0.27 b |
| 2 - (N/S + N) | 250.0 | 3.05 bc | 7.89 ab | 14.3 | 0.21 b |
| 3 - (N/S + N/S) | 246.0 | 2.52 bc | 6.80 bc | 15.3 | 0.27 b |
| 4 - (N +N/B) | 252.4 | 3.82 a | 8.14 a | 12.9 | 0.35 a |
| 5 - (N/S + N/B) | 247.0 | 2.91 bc | 5.78 c | 12.7 | 0.25 b |
| 6 - (N/S + N/S/B) | 251.4 | 2.49 c | 5.78 c | 15.2 | 0.39 a |
| p-value | 0.6860 | 0.0178 | 0.0057 | 0.5481 | 0.0077 |
| Numbers followed by different letters are significantly different at P=0.10 by Tukey LSD. | |||||
Adding S as a starter or sidedress did not result in significant uptake by the corn plant. The concentration of S in the ear-leaf tissue at tassel was within normal ranges (0.18-0.20 ppm) and was not affected by S additions. Either the corn crop did not need additional S, or uptake requires different pathways, such as foliar applications. It did appear that the addition of B alone decreased S uptake in corn. Boron applications, when applied with S at sidedress (treatment 6), did increase in the plant, but not in any other treatment. This only represents one year of data, but it is possible that S aids in the uptake of B into the plant, without increasing its own concentrations. The only other ear-leaf nutrient affected by the S and B additions was magnesium (Mg), which was lower with just S additions (going from treatment 1 to 3), but not as low when B was added with S at sidedress.
| Treatment | N | P | K | Ca | Mg | S | B |
|---|---|---|---|---|---|---|---|
| ------------------------------------------------- % --------------------------------------------- | |||||||
| 1 - (N + N) | 3.32 | 0.33 | 2.60 | 0.34 | 0.15 a | 0.20 | 6.38 b |
| 2 - (N/S + N) | 3.29 | 0.31 | 2.69 | 0.33 | 0.14 c | 0.19 | 6.00 b |
| 3 - (N/S + S) | 3.17 | 0.32 | 2.66 | 0.33 | 0.14 bc | 0.19 | 6.18 b |
| 4 - (N +N/B) | 3.12 | 0.32 | 2.73 | 0.32 | 0.15 a | 0.18 | 5.99 b |
| 5 - (N/S + N/B) | 3.14 | 0.31 | 2.78 | 0.31 | 0.14 bc | 0.19 | 6.50 b |
| 6 - (N/S + N/S/B) | 3.24 | 0.32 | 2.86 | 0.32 | 0.15 ab | 0.19 | 7.63 a |
| p-value | 0.6326 | 0.4075 | 0.1727 | 0.4539 | 0.0264 | 0.2761 | 0.0124 |
| Numbers followed by different letters are significantly different at P=0.10 by Tukey LSD. | |||||||
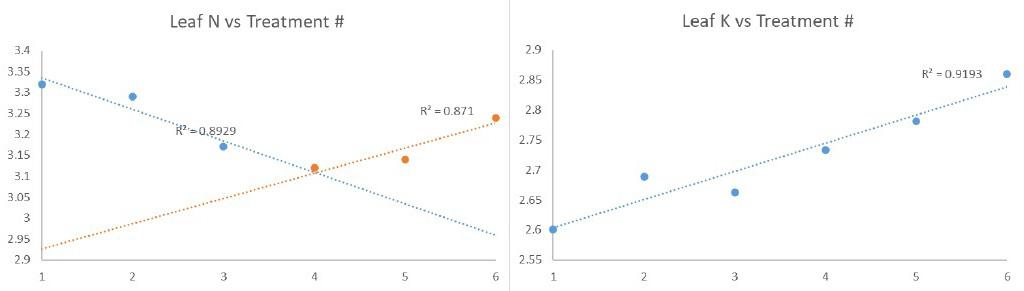
Although not significant (Table 2), there were trends present with both N and K in the plant tissue (Figure 2). When S was steadily added to treatments 1-3, N contents appear to decrease in the ear leaf tissue. In treatment 4, N content starts off low where B was added at sidedress, but appears to increase with the addition of S in treatments 5 and 6. For K, the addition of S (1-3) along with the addition of S and B (4-6) appears to steadily increase K uptake. This may explain why Mg was lower in treatments with S, as it competes for uptake with K.
Summary:
Although no yield differences were observed, additions of S and B did affect uptake of at least Mg, but maybe also N and K. In fields where those nutrients are deficient, interference in uptake may exacerbate yield issues. To increase B uptake in corn, it may be necessary to add S at sidedress as well.
When considering leaching of anions, B did not move to the subsurface by harvest, but sidedess S additions did. This only represents one year of data though and cannot necessarily be compared across all soil types or field conditions.
This research was supported by the Maryland Grain Producers.
This article appears on November 2021, Volume 12, Issue 8 of the Agronomy news