
A Comparison between Perennial and Perennial/Annual Combination Forage Systems under Mixed-Species Grazing
By Dr. Amanda Grev, Forage Extension Specialist, and Jeff Semler, Ag Extension Educator
Livestock producers are increasingly interested in including annual forages along with perennials in forage systems for grass-fed livestock. Annual forages can be a quick-growing, high-quality, and high-yielding forage option and can increase forage availability across the growing season; however, establishing annual forages does require additional time and financial inputs. To explore this, a study was started at the Western Maryland Research and Education Center to compare a perennial-only versus a perennial/annual combination forage system under mixed-species grazing. The objectives of the study are to compare forage production, forage quality, livestock performance, and soil health between these grazing systems, along with the economic feasibility of using a perennial/annual combination system compared to a more traditional perennial-based forage grazing system.
Methods
In 2023-2025, a mixed-species herd consisting of 30-35 lambs and 19 calves were utilized for this study. Livestock were sourced from a local Maryland producer and were transported to the research center in April or early May of each year. After a brief acclimation period, all animals were weighed and measured, blocked by age, bodyweight, and body condition score, and randomly assigned to treatment system.
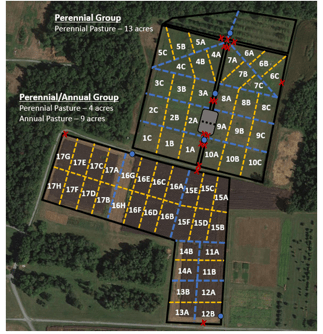
Animals in the perennial-only forage system (PER) were rotationally grazed across 13 acres of cool-season perennial mixed pasture. Dominant pasture species in the PER system included orchardgrass, tall fescue, red clover, white clover, and alfalfa. Animals in the perennial/annual combination forage system (ANN) were rotationally grazed across 13 acres of both perennial and annual pastures. Perennial pastures in this system consisted of a similar cool-season perennial mixture, and annual pastures were established on a seasonal, rotating basis using cool-season annuals followed by warm-season annuals. For both treatment groups, pastures were subdivided into approximately 0.5 to 0.9-acre paddocks and animals were rotated to a new paddock every 1-7 days depending on forage availability. Animals in both groups also had ad libitum access to a commercial mineral mix to ensure appropriate mineral intake. An overview of the pasture layout for both groups is shown in Figure 1.
Animals in both treatment groups grazed their respective treatment areas annually from April/May through the end of the grazing season (September-November depending on the year). Throughout the grazing season, animals in the ANN forage system alternated between annual and perennial pastures based on forage availability and growth. For example, in 2024 the ANN group grazed winter annual forages from April 8–June 16, perennial forages from June 17–July 8, summer annual forages from July 9–September 17, perennial forages from September 18–October 22, and winter annual forages from October 23–November 12.
Throughout the study, both treatment groups were measured every two weeks to determine bodyweight, body condition score (1-5 scale for lambs; 1-9 scale for cattle), and FAMACHA© score (lambs only). Fecal samples were also collected to monitor parasite load via fecal egg counts. Forage samples were collected every two weeks to determine forage yield and forage nutritive value; for each treatment group, samples were collected from the subsequent paddock in the rotation prior to grazing.
Results
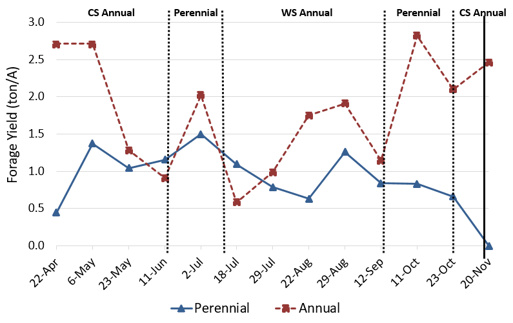
A full analysis of the results for this study are in progress, but some preliminary results from the 2023-2024 grazing seasons are presented here. Forage yields varied throughout the growing season; however, annual forage yields were generally greater compared to perennial forages (Figure 2). The average nutrient composition of the perennial pastures grazed by the PER group and the perennial and annual pastures grazed by the ANN group are shown in Table 1.
| Nutrient (% DM) | Perennial Only: Mix 1 | Perennial Only: Mix 2 | Perennial/Annual Combination: Cool-Season Annual | Perennial/Annual Combination: Warm-Season Annual |
|---|---|---|---|---|
DM | 27.3a | 30.0a | 21.7b | 19.7b |
NDF | 55.4a | 54.0a | 42.0b | 40.9b |
ADF | 30.9a | 31.9a | 26.2b | 23.1b |
CP | 17.6 | 16.5 | 20.5 | 20.0 |
TDN | 68.2b | 64.0c | 71.4a | 71.2a |
NSC | 15.8b | 14.1b | 22.0a | 21.7a |
Animal performance data for the lambs is presented in Table 2. On average, the PER lambs gained 0.20 pounds per day compared to 0.26 pounds per day for the ANN lambs. The ANN lambs ended the grazing season with a greater BCS in both years and with a higher final BW in 2024. Lamb FAMACHA© scores remained low (1-2) for both treatment groups throughout the course of the grazing season. No lambs received a FAMACHA© score higher than 3 at any point. This was somewhat expected, as parasite pressure was likely very low in all pastures.
LAMBS | 2023 Perennial Only | 2023 Perennial/Annual Combination | 2024 Perennial Only | 2024 Perennial/Annual Combination |
|---|---|---|---|---|
Initial BW, lbs | 79.2 | 79.1 | 72.2 | 74.4 |
Final BW, lbs | 110.7 | 115.7 | 108.4a | 129.2b |
ADG, lbs/d | 0.23a | 0.26b | 0.17a | 0.26b |
Initial BCS | 3.0 | 3.1 | 3.0 | 2.9 |
Final BCS | 3.8a | 4.0b | 3.5a | 3.8b |
FAMACHA© | 1.3 | 1.5 | 1.3 | 1.5 |
Animal performance data for the calves is presented in Table 3. On average, the PER calves gained 1.40 pounds per day compared to 1.72 pounds per day for the ANN calves. In both years, the ANN calves ended the grazing season with a greater final BW. There was no difference in final BCS in 2023 but in 2024 the ANN calves had a higher final BCS.
CALVES | 2023 Perennial Only | 2023 Perennial/Annual Combination | 2024 Perennial Only | 2024 Perennial/Annual Combination |
|---|---|---|---|---|
Initial BW, lbs | 391.1 | 445.1 | 480.0 | 487.0 |
Final BW, lbs | 601.1a | 672.8b | 734.0a | 868.0b |
ADG, lbs/d | 1.50 | 1.63 | 1.30a | 1.81b |
Initial BCS | 5.0 | 5.0 | 5.0 | 5.0 |
Final BCS | 5.5 | 5.5 | 5.5a | 6.0b |
Conclusions and Future Plans
Preliminary results from this study show that lambs and calves are able to grow and maintain good body condition on both a perennial-only and a perennial/annual combination forage system. Initial results suggest that using annual forages in combination with perennial forages may be a successful strategy to increase total forage production and average daily gains for pasture-based livestock systems.
Additional data for each of these pasture systems is still being compiled. This study was also repeated for a third year during the 2025 grazing season; this data needs to be added to the full data set. Moving forward, a full analysis of this study will be completed, along with a comprehensive analysis comparing the economics behind each of these systems.
Producers looking to improve grazing systems on their farm should begin by exploring simple management changes including the implementation (or increased intensity) of rotational grazing practices. Incorporation of annual forages into the grazing system may also help improve animal performance and can offset the reduced summer growth (i.e. summer slump) in perennial pastures, particularly during dry years.
Acknowledgements
Education Center in support of this study. Funding for this study comes from the Northeast Sustainable Agriculture Research and Education program.
Interested in more forage-related resources and information?
Sign up for our monthly email at https://go.umd.edu/forageemails
Check out our website at https://go.umd.edu/forage
Follow us online @MarylandForages on Facebook, Instagram, and YouTube
This page's content is updated annually with the latest results from the research trial. The information was last updated on 9/14/2026.
-
Back to Research Updates >
Back to Research Updates >