Up and Down: Maryland Weather at its Finest
It feels that most years we find ourselves finding something abnormal about the weather. This year is no exception and in some ways is even more different from our “abnormal-normal.”
Put lightly, the 2022-2023 winter was mild. There were only a handful of instances where we fell significantly below freezing and stayed there for more than a night or two. In fact, the average temperature from January to March of 2023 of 43.4 degrees Fahrenheit, was the second warmest on record in the 128-year NOAA Statewide Time Series dataset, just falling behind 2012 at 43.5 degrees Fahrenheit.
With this comes a significant accumulation of Growing Degree Days (GDD), a heuristic tool measuring the accumulation of heat through time which can be used to predict the development of crops and insects during the growing season. For review, GDDs are calculated by taking a simple average of the high and low daily temperatures subtracted from some base level. The base level is determined for each crop representing the lowest temperature the plant may still develop. For wheat and other small grains, the base temperature is often 32 or 40°F, while warm season crops like corn and soybeans have a GDD base temperature of 50°F.

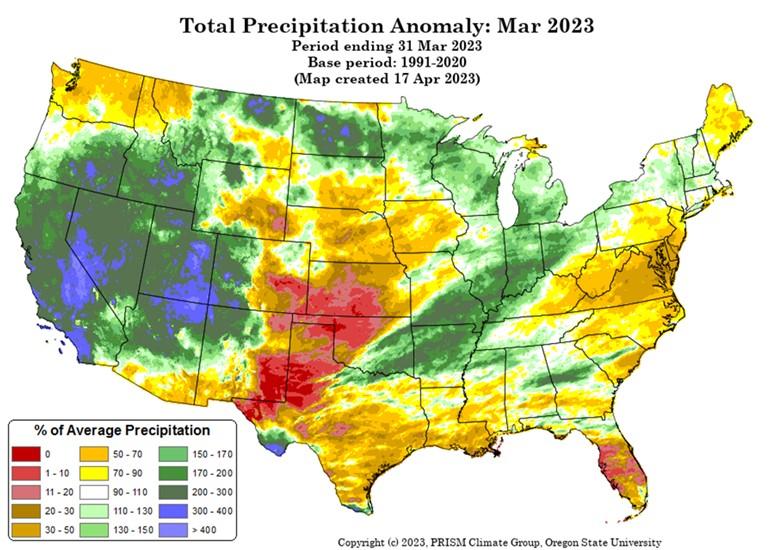
Figure 1 is a cumulative line chart illustrating the accumulation of growing degree days since the start of the year in Frederick, MD. These data were obtained from the Cornell Climate Smart Farming (CSF) Growing Degree Day Calculator measured at a Frederick County, MD location, and a base temperature of 50 degrees (corn/soybeans base).
The chart illustrates the significant accumulation of GDDs in the last three months with the green line-and-dot figure poised well above the 15 year and 30-year averages. Of note is the rapid accumulation of GDDs in early to mid-April–illustrated by the rather large upward slope in a relative short period of time. Though we have not set any records, illustrated by the gray-bands above and below the data, we certainly came close in mid-April. This run-up coincided with abnormally dry conditions as well.
On the precipitation front, the region has generally been below average coming out of the winter months. Data from NASCE Prism Climate Group at Oregon State and USDA RMA (Figure 2) illustrates the precipitation anomaly, or difference in rainfall compared to the average from January to March for the continental US. We may observe how the Mid-Atlantic held a range from 50-70% of average rainfall for the time period ending on March 31st.
The saying, “April showers bring May flowers” generally holds true in Maryland: on average and depending on the region in Maryland, we receive 3-5” of rainfall in April. This year, much of the region did not receive significant precipitation from April 1st to April 21st. Other regions only had to hold out another week to April 27th -28th to finally quench their thirst. These much-needed rains have brought much of the region at or near seasonal averages–bittersweet news for some crops that were in the rapid-development stage during the dry-period and for others that were “dusted-in” (planted into dry soil) in mid-April.
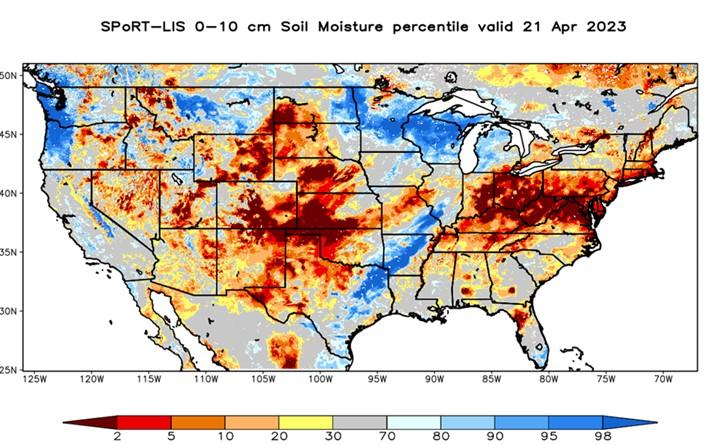
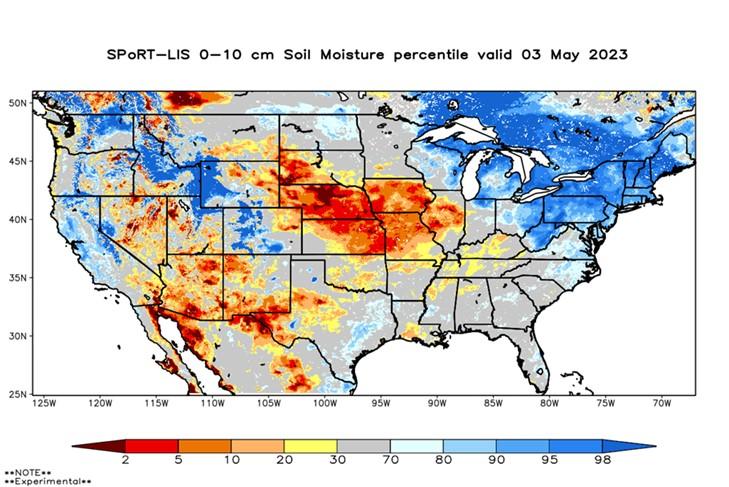
Speaking of; soil moisture has obviously reflected precipitation trends. Figure 3 (next page) are NASA Soil Moisture models based on satellite data. Figure 3, shows the model before our first rain on April 21st, while Figure 4 is the most recent model at the time of writing. We may observe how drastic the change in soil moisture has been in the last two to three weeks moving from a significant deficit (red areas, Figure 3) to nearly oversaturation (darker blue areas, Figure 4).