

FS-2026-0813 | September 2026
UNIVERSITY OF MARYLAND EXTENSION AND MARYLAND SEA GRANT COLLEGE
Maryland Shellfish Aquaculture Industry: 2024 at a Glance
Report Highlights
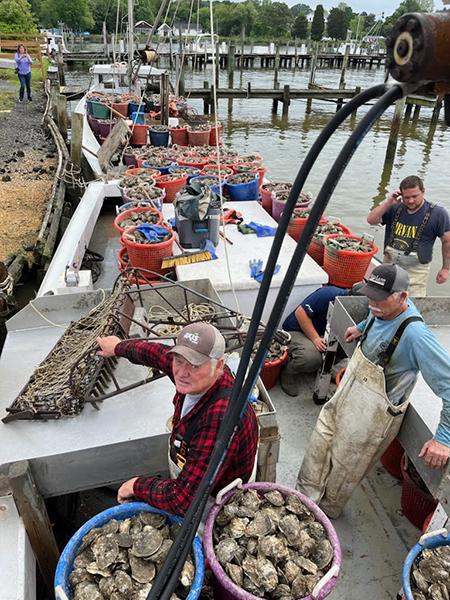
The Maryland oyster aquaculture industry reported a harvest of 81,403 bushels in 2024, a decrease of 12,883 bushels from 2023. The level of bay scallop harvest has remained relatively stable since its first instance in 2022, though there was a slight decrease from 2023 to 2024, and there was a very modest hard clam harvest reported for another consecutive year, after an absence of farm-raised clam harvest from 2018 to 2022. (The quantity and value of the bay scallop and clam harvests are not reported to maintain business privacy since there are fewer than three growers of each in the state). Both the average price of single oysters and the average price for oysters sold as bushels decreased, as determined from dealer and grower-reported sales information standardized by volume. The estimated dockside value of the oyster aquaculture industry in Maryland for 2024 was $5,944,461. The Maryland Department of Natural Resources (MDNR) received 16 new shellfish aquaculture lease applications and issued 14 new shellfish leases in 2024 (MDNR, 2025).
2024: Harvest Summary
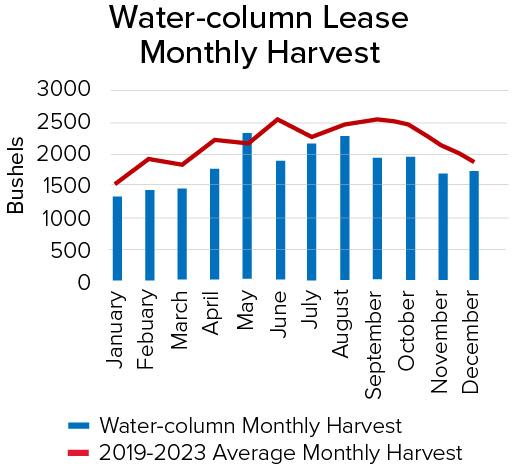
harvest in 2024. Data courtesy of MDNR, 2024. Visualization by the authors.
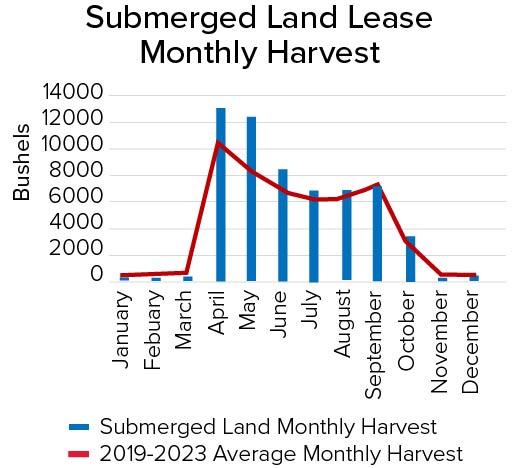
harvest in 2024. Data courtesy of MDNR, 2025. Visualization by the authors.
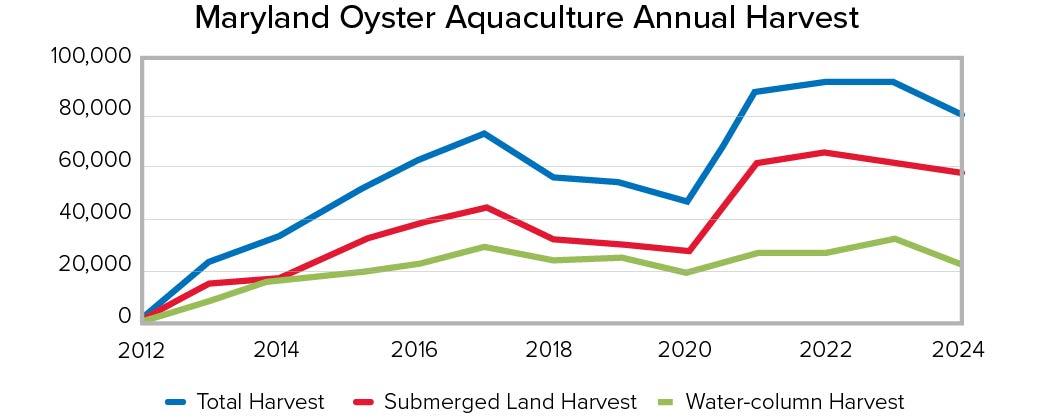
The 2024 Maryland oyster aquaculture harvest was its lowest since 2021, when the industry was still rebounding from COVID losses. The 2024 harvest registered 81,403 bushels of oysters (Crassostrea virginica), with 59,363 bushels harvested from submerged land leases and 22,040 bushels from water-column lease types (Figure 1). MDNR uses a conversion factor of 300 single oysters per bushel. Submerged land lease oysters are grown on and harvested directly from suitably prepared bottom, while those grown on water-column leases are single animals placed in containerized gear (e.g., baskets, cages, bags, etc.), most commonly in cages that rest on the bottom or are suspended beneath surface floats. The 2024 farm-raised oyster harvest saw a decrease of 12,883 bushels compared to 2023, and the 2024 harvest totals reported from both submerged land leases and water column leases were at their lowest since 2020 (Figure 1). The bulk of harvest from submerged land leases typically occurs from April 1 to September 30 when leaseholders can take advantage of higher prices and avoid competition with the wild oyster fishery harvest during public harvest months, while the water-column harvest is relatively consistent throughout the year (Figures 2 & 3). It should be noted the 5-year average lines in Figures 2 & 3 were influenced by market closures in 2020 as a result of the COVID-19 Pandemic when farms were unable to sell product, and therefore reduced harvests.
Economic Impact of Oyster Aquaculture in Maryland
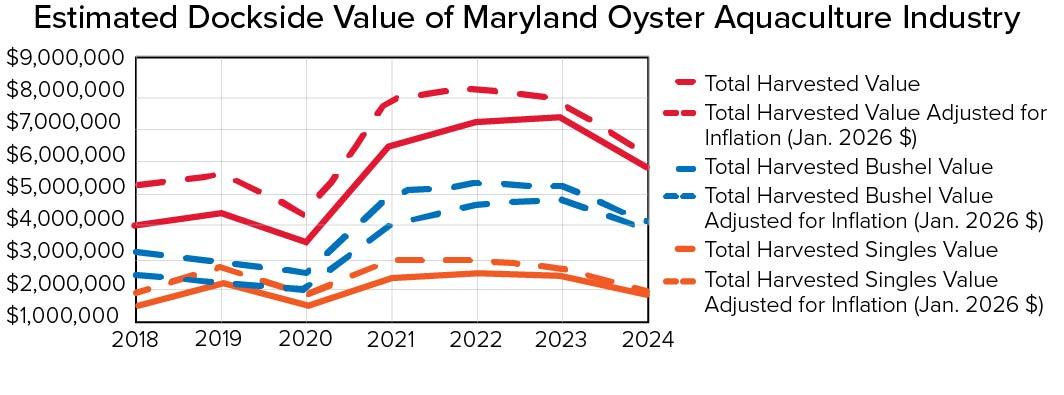
The decreased harvest from leases in 2024 contributed to the lowest dockside value for farmed oysters since 2020. In 2024, the estimated dockside value of aquaculture oysters in Maryland was $5,944,461. This is a decrease of over $1.4 million compared to the 2023 estimated dockside value (Figure 4), driven by lower harvests and lower average costs for both single oysters and those sold as bushels (Maryland Department of Natural Resources, 2025). Based on information in van Senten et al. (2020), the estimated economic impact of the oyster aquaculture industry to the state of Maryland was $11,516,932.
Aquaculture operations in Maryland sell oysters by the bushel or individually as single oysters (singles) to a variety of markets which may range from wholesalers to direct-to-consumer sales, each with different prices that can fluctuate by product and/or by season. The average price for Maryland oysters sold by the bushel remained steady at $55 per bushel from 2017-2021, increased to approximately $62 in 2022, and increased again to $63.85 in 2023. In 2024, the average price per bushel decreased to $61.58. The average price per Maryland oyster sold as singles was $0.40 per oyster in 2017 and 2018, then increased to $0.50 per oyster in 2019 where it remained through 2021. The average price of singles in 2022 and 2023 was approximately $0.47 per oyster but decreased in 2024 to $0.40 per oyster. Annual price averages were also adjusted for inflation using the Bureau of Labor Statistics CPI Inflation Calculator and are shown in 2026 dollars. Note that average dockside prices are calculated via self-reported wholesale and retail real price averages, standardized by sales volume, from annual surveys returned to the MDNR (Table 1).
| YEAR | AVERAGE PRICE OF SINGLES ($/OYSTER) | AVERAGE PRICE OF SINGLES ADJUSTED FOR INFLATION (2026 $/OYSTER) | AVERAGE PRICE OF BUSHELS ($/BUSHEL) | AVERAGE PRICE OF BUSHELS ADJUSTED FOR INFLATION (2026 $/BUSHEL) |
| 2024 | $0.40 | $0.42 | $61.85 | $65.23 |
| 2023 | $0.47 | $0.51 | $63.85 | $69.85 |
| 2022 | $0.47 | $0.54 | $62.00 | $71.73 |
| 2021 | $0.50 | $0.62 | $55.00 | $68.39 |
| 2020 | $0.50 | $0.63 | $55.00 | $69.34 |
| 2019 | $0.50 | $0.65 | $55.00 | $71.07 |
| 2018 | $0.40 | $0.52 | $55.00 | $72.17 |
As with previous years, the total value of oysters sold to bushel markets in Maryland in 2024 was higher than the total value sold as singles. Annual values were also adjusted for inflation using the Bureau of Labor Statistics CPI Inflation Calculator and are shown in 2026 dollars (Figure 4). The authors of this publication used the economic ratios published in van Senten et al. (2020) to estimate the total economic impact of the oyster aquaculture industry on Maryland to be approximately $11.5 million in 2024.
Unique grower financing programs continue to play an important role in supporting the growth of the shellfish aquaculture industry in Maryland. Since its inception in 2010, the Maryland Agricultural Resource-Based Industry Development Corporation (MARBIDCO) has approved loans totaling nearly $6 million through the Maryland Shellfish Aquaculture Financing Fund (MSAFF) and the Maryland Shellfish Remote Setting Loan Fund (MSRSLF). MARBIDCO’s shellfish loan program features interest-only payment periods and principal forgiveness if certain conditions are met. In CY 2024, MARBIDCO approved two loan applications totaling $150,000 for the MSAFF (MARBIDCO, 2024).
Lease Data
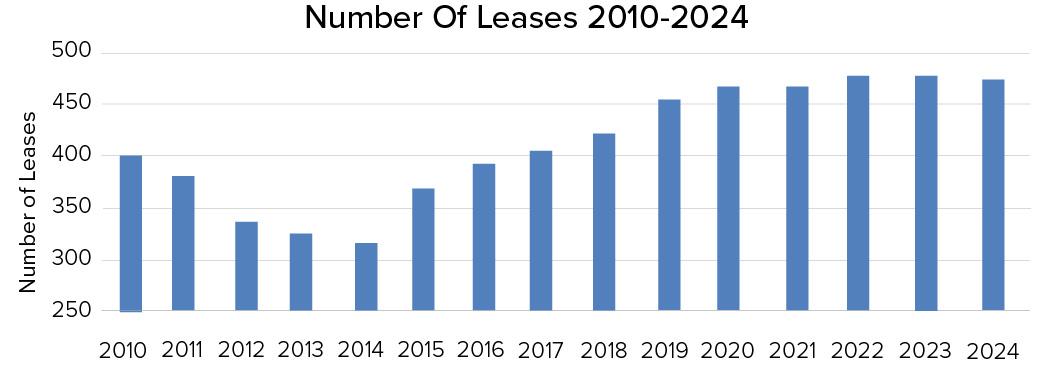
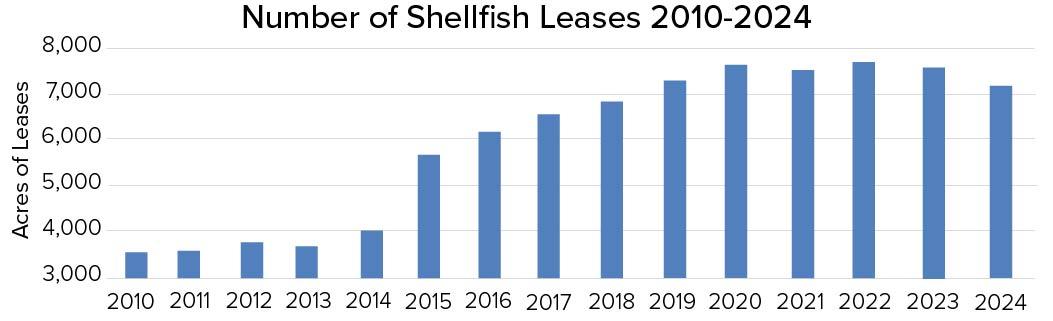
At the end of 2024, there were 474 shellfish leases comprising 7,710.4 acres of Maryland waterways. Submerged land leases accounted for 7,158.4 acres on 375 sites, while 99 water-column leases covered 552 acres (Figures 5 & 6) (Maryland Department of Natural Resources, 2024). This is an increase of overall lease acreage but on fewer total lease areas as compared to the end of 2023, which ended with 478 shellfish leases on 7,579 acres (Maryland Department of Natural Resources, 2024). During the calendar year 2024, the MDNR received 16 new commercial shellfish lease applications and issued 14 new leases. At the end of 2024, 83 lease applications were in process by MDNR (Maryland Department of Natural Resources, 2025). In many instances, an individual or business entity may hold more than one lease while operating as a single entity. In other cases, leases may be held in the names of distinct individuals but operate as a single business or partnership. The MDNR collects data on each lease through mandatory annual reporting to ensure “active use” in accordance with state statute. While MDNR does not formally collect data for the total number of aquaculture businesses, the number of distinct leaseholders has hovered between 165 and 175 since 2017. The number of distinct leaseholders can be used as a proxy to estimate the number of aquaculture businesses in Maryland.
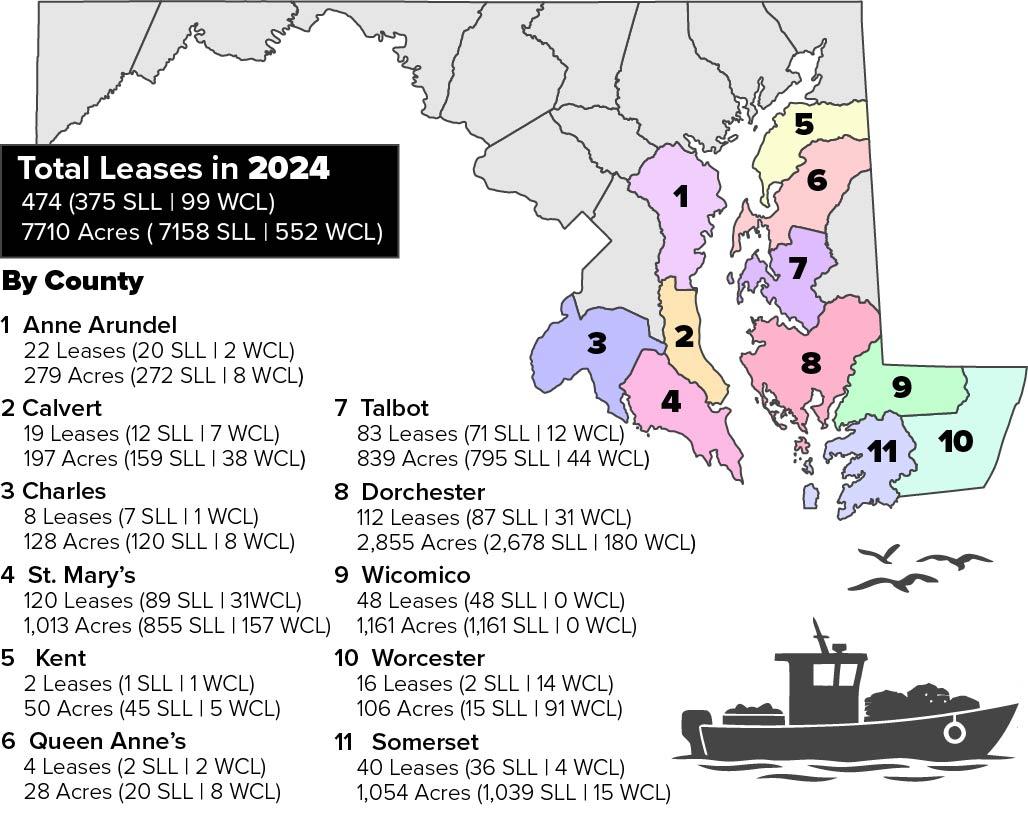
Maryland shellfish leases were located in 11 counties in 2024 (Figure 7) (Maryland Department of Natural Resources, 2024). There is no regulated minimum or maximum shellfish aquaculture lease size in Maryland. Therefore, leases range in size from less than one acre to several hundred acres. In Maryland, water-column leases are generally smaller than submerged land leases; the average water-column lease size was 5.67 acres (range: 0.12 - 39.6 acres), as compared to the average submerged land lease size of 19.13 acres (range: 0.08 - 310.7 acres) in 2024.
Nursery Production
Shellfish nursery operations in Maryland are comprised of both hatchery facilities and in-water or land-based nursery facilities. The latter most typically includes some combination of tanks used seasonally for remote setting larvae, and/or seed husbandry in upwellers, downwellers or floating containers of various styles. Shellfish nursery activities may be authorized under either a shellfish aquaculture lease or a Shellfish Nursery Permit, depending on nursery type, size and location. Leases or facilities established for nursery-only production are limited to cultivating shellfish seed up to a maximum size of one inch as measured from hinge to bill, at which point the product must be relocated to an alternate permitted location. Shellfish nursery permits issued by MDNR are non-transferrable and have a five-year renewable term. In 2024, the Department issued nine new shellfish nursery permits; a total of 69 nursery facilities were permitted for at least some portion of the year, in addition to eight leases that were designated for nursery-only production (MDNR, 2025).
References
Maryland Department of Natural Resources. 2024- 2026. All lease, leaseholder, harvest, and dockside value data are provided courtesy of MDNR staff via email communication and direct contribution to the text.
MARBIDCO. 2025. MARBIDCO loan information is provided courtesy of MARBIDCO staff via email request from the authors.
van Senten, J., Engle, C, Parker, M, and Webster, D. (2020) Analysis of the economic benefits of the Maryland shellfish aquaculture industry. Chesapeake Bay Foundation. Annapolis, MD. 51pp.
University of Maryland Extension and Maryland Sea Grant Extension work to support sustainable fisheries and aquaculture in the state. For more information about shellfish aquaculture in Maryland, including resources for current and new growers, please visit extension.umd.edu/aquaculture, dnr.maryland.gov/fisheries/Pages/aquaculture/index.aspx, and go.umd.edu/OysterAquacultureDashboard
MATTHEW PARKER*
University of Maryland Extension
mparke11@umd.edu
DONALD WEBSTER
University of Maryland Extension
dwebster@umd.edu
REBECCA THUR
Maryland Department of Natural Resources
Rebecca.Thur@maryland.gov
*Corresponding author: Matthew Parker | mparke11@umd.edu | 301-226-7436
The authors would like to thank the Maryland Department of Natural Resources and MARBIDCO for providing data on shellfish aquaculture in Maryland. Additionally, the authors would like to thank University of Maryland’s Extension Publications Team and peer reviewers for providing content edits and Maryland Sea Grant communications team for providing copyediting and graphic design for this publication.
Maryland Shellfish Aquaculture Industry: 2024 at a Glance (FS-2026-0813), is a part of a collection produced by the University of Maryland Extension within the College of Agriculture and Natural Resources. The information presented has met UME peer review standards, including internal and external technical review. For help accessing this or any UME publication contact: itaccessibility@umd.edu. For more information on this and other topics, visit the University of Maryland Extension website at extension.umd.edu.
University programs, activities, and facilities are available to all without regard to race, color, sex, gender identity or expression, sexual orientation, marital status, age, national origin, political affiliation, physical or mental disability, religion, protected veteran status, genetic information, personal appearance, or any other legally protected class.
When citing this publication, please use the suggested format:
Parker, M., Webster, D., & Thur R. (2026, September ). Maryland Shellfish Aquaculture Industry: 2024 at a
Glance (FS-2026-0813). go.umd.edu/FS-2026-0813.
Additional Resources on the Shellfish Aquaculture Industry in Maryland
-
Maryland Shellfish Aquaculture Industry: 2023 at a Glance (FS-2024-0732) >
Maryland Shellfish Aquaculture Industry: 2023 at a Glance (FS-2024-0732) > -
Maryland Shellfish Aquaculture Industry: 2022 at a Glance (FS-2023-0702) >
Maryland Shellfish Aquaculture Industry: 2022 at a Glance (FS-2023-0702) > -
Maryland Shellfish Aquaculture Industry-2021 at a Glance (FS-2023-0672) >
Maryland Shellfish Aquaculture Industry-2021 at a Glance (FS-2023-0672) > -
Maryland Oyster Aquaculture Industry in 2020 at a Glance (EBR-62) >
Maryland Oyster Aquaculture Industry in 2020 at a Glance (EBR-62) >