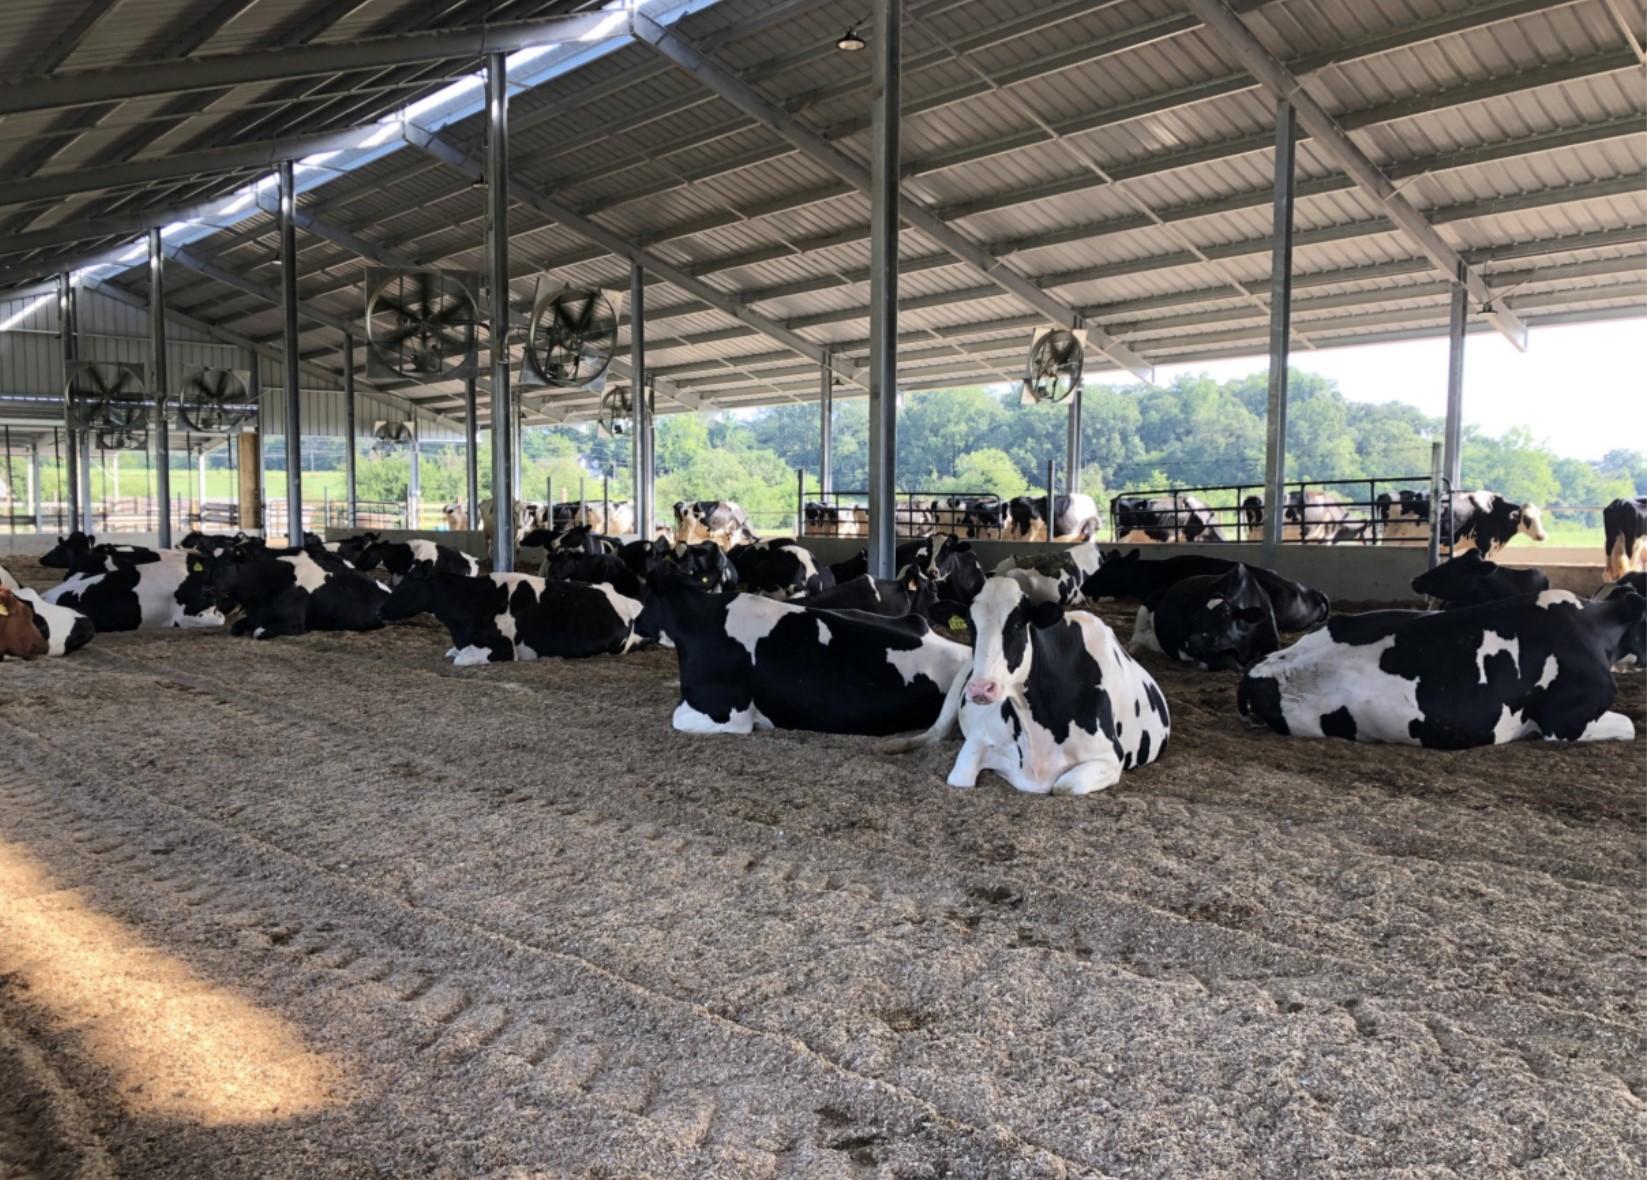
Dairy Cattle laying down in shelter
Updated: September 24, 2021
By Dale Johnson

Maryland Dairy Economics

These are difficult days for dairy farmers. After the high milk prices of 2014, prices have plummeted with no significant upturn in sight. Large dairies across the country have captured economies of scale that turn a profit at these low prices. So as small dairies go out of business, the large dairies continue to expand, maintaining the supply that suppresses the prices.

Most dairy farmers watch milk checks to track milk price. But do you know what your profit per cow is or how much it costs you to produce a hundred pounds of milk? Dairy farming is complex, and determining your profit and costs of production is sometimes difficult. Yet, it is important to understand them.

I encourage dairy farmers to calculate income and expenses on a per cow basis and cwt basis. This will give you good perspective on your profit, enabling you to analyze your efficiency. Each year, the University of Maryland Extension conducts the Maryland Dairy Farm Business Summary. Through this summary, we work individually with dairy farmers to calculate their income and expenses per cow and per cwt. Data from all farms participating are then summarized to determine industry-wide average income, expense, and profit per cow or per cwt. This gives farmers benchmarks with which they can compare their farm.
 

“...calculate income and expenses on a per cow and per cwt basis. This will give you a good perspective on your profit, enabling you to analyze efficiency.”
FOCAL POINT

  • Determine income and expenses on a per cow and per cwt basis to help you compare your farm to benchmarks from year to year
     
  • Extension works with a subset of farms annually to establish state-wide financial benchmarks
     
  • During the 2018-2020 period, profit per cow averaged $425
     
  • During the 2013-2015 period, profit per cow averaged $840


The tables below summarizes income, expenses, and profit per cow and per cwt and for 18 conventional non-organic dairy farms and 7 organic dairy farms. It shows annual averages for 3 years, from 2018-2020. As you compare your farm to the averages, you may want to take a careful look at costs that are more than 20 percent higher than the average to see if you can improve your management of those areas of your business. If some of your costs are more than 20 percent lower than average, then these may be areas of strength in your business.


TABLE 1: 2018-2020 AVERAGE OF MARYLAND DAIRY FARMS (Income, Expenses, and Profit per Cow)

2018-2020 AVERAGE OF MARYLAND DAIRY FARMS
Income, Expenses, and Profit per COW
  CONVENTIONAL (NON-ORGANIC) FARMS ORGANIC
7 FARMS
  Total 18 Farms High 9 Farms Low 9 Farms  
Average number of cows 134 158 112 86
CWT of milk sold per cow 207 212 201 90
FARM INCOME
Milk sales 3,617 3,780 3,413 2,947
Cattle sales 255 235 280 439
Other Income 781 845 701 222
Total Income 4,653 4,860 4,394 3,608
FARM EXPENSES
Feed purchased 1,204 1,183 1,231 935
Seed, fertilizer, chemicals 449 492 395 182
Depreciation and repairs 657 719 579 575
Labor 175 171 180 56
Medical and breeding 191 160 229 46
Car, Truck, Fuel, Hauling 397 412 379  
Rent 209 207 211 146
Interest 156 131 188 99
Custom hire 274 243 312 170
Other expenses 517 490 550 434
Total Expenses 4,228 4,207 4,254 2,642
PROFIT PER COW 425 653 140 852

TABLE 2: 2018-2020 AVERAGE OF MARYLAND DAIRY FARMS (Income, Expenses, and Profit per CWT)

2018-2020 AVERAGE OF MARYLAND DAIRY FARMS
Income, Expenses, and Profit per CWT
  CONVENTIONAL (NON-ORGANIC) FARMS ORGANIC
7 FARMS
  Total 18 Farms High 9 Farms Low 9 Farms  
Average number of cows 134 158 112 86
CWT of milk sold per cow 207 212 201 90
FARM INCOME
Milk sales 17.46 17.84 16.97 33.80
Cattle sales 1.23 1.11 1.39 3.56
Other Income 3.77 3.99 3.49 4.12
Total Income 22.46 22.94 21.84 41.48
FARM EXPENSES
Feed purchased 5.81 5.58 6.12 10.40
Seed, fertilizer, chemicals 2.17 2.32 1.96 2.02
Depreciation and repairs 3.17 3.39 2.88 6.40
Labor 0.84 0.80 0.89 0.62
Medical and breeding 0.92 .75 1.14 0.51
Car, Truck, Fuel, Hauling 1.92 1.95 1.88 2.29
Rent 1.01 0.98 1.05 1.62
Interest 0.75 0.62 0.93 1.10
Custom hire 1.32 1.15 1.55 1.90
Other expenses 2.49 2.31 2.73 4.83
Total Expenses 20.41 19.85 21.15 31.69
PROFIT PER CWT 2.05 3.08 0.70 9.48
NET PROFIT PER FARM 70,608 144,801 9,065 65,585


Over the years the annual average profit per cow increased to a high of $840 per cow per year over the three years from 2013-2015. But for 2018 to 2020, the annual average profit per cow has plummeted $425 per cow. There is a considerable range around this average as the most profitable nine farms made an average of $653 per cow per year and the least profitable farms made $140 per cow.

Profit per cow for organic milk production is considerably higher at $852 per cow. However, organic processors are limiting the number of new farms they are accepting milk from and in some cases put quotas on existing organic farms.

If you would like your farm to participate in this analysis to get a good financial summary for your farm, please contact Dale Johnson at or 301-432-2767x325 or dmj@umd.edu.

This article appears on the September 22, 2021, Volume 2, Issue 3 of the Maryland Milk Moo's newsletter.

Maryland Milk Moo's, September 22, 2021, Vol.2, Issue 3

Maryland Milk Moos is a quarterly newsletter published by the University of Maryland Extension that focuses on dairy topics related to Nutrition and Production, Herd Management, and Forage Production. To subscribe to this newsletter, click the button below to enter your contact information.

Subscribe