Maryland’s 2025 Cash Rental Rates
By Elizabeth Thilmany, Affiliated Faculty Specialist, Department of Agricultural and Resource Economics
Cash rent lease agreements continue to be the most common type of agricultural lease agreements in Maryland, offering a fixed annual payment per acre and relieving landowners of operating and marketing decisions. Each year, USDA's National Agricultural Statistics Service (NASS) estimates average cash rental rates per acre for irrigated cropland, non-irrigated cropland, and pastureland at the county and state levels based on farm-level survey data. For more information on the NASS Cash Rents Survey, visit https://www.nass.usda.gov/Surveys/Guide_to_NASS_Surveys/Cash_Rents_by_County/.
For 2025, the University of Maryland has updated our Maryland Agricultural Cash Rental Rates Report to provide Maryland-specific insights into these rental rates, supporting producers, landowners, and other stakeholders in making informed leasing and land management decisions. The 2025 report includes rental rate data for non-irrigated cropland, irrigated cropland, and pastureland, organized by county and agricultural regions.
Updates in the 2025 Report:
- Updated trend graphs: Visualizations with trendlines show how rental rates have shifted over time, offering a clear picture of recent changes in Maryland’s cropland and pastureland values.
- County breakdowns: Detailed rental rate tables highlight variations across counties and agricultural regions.
- Static maps: 2025 maps illustrate county-level rental rates for non-irrigated cropland and pastureland, allowing producers to quickly compare rental conditions statewide.
Insights from this year’s data:
- The Upper Eastern Shore continues to report the highest non-irrigated and irrigated rental rates, reflecting strong demand and productivity.
- Southern Maryland and Western Maryland (mainly Garrett County) remain the regions with the lowest rental rates.
Accessing the Report
The full 2025 report and downloadable data files are available here: [insert link].
Rental rate data will also be integrated into the Maryland Grain Budget Planner (go.umd.edu/efmd) in the coming weeks. Developed by the Elevating Farm Management Data team, this free, web-based tool combines crop budgeting with grain marketing analysis. Producers can use it to:
- Track trends, project expenses, and benchmark profitability.
- Customize inputs to fit their operation.
- Provide feedback to improve future versions of the tool.
USDA, National Agriculture Statistics Service
2025 Maryland Agricultural Cash Rental Rates Report: Trends and Analysis by County and Land Type
Cash land rental rate agreements, the most common lease structure in Maryland’s agricultural industry, involve a fixed annual payment per acre. In these agreements, landowners are relieved of operational and marketing decisions. Tenants, in turn, assume the risks and returns of crop production and have the flexibility to manage crops and livestock according to their own strategies.
The USDA National Agriculture Statistics Service (NASS) conducts an annual survey to estimate state- and county-level cash rental rates for irrigated cropland, non-irrigated cropland, and pastureland through NASS’s Quick Stats database (quickstats.nass.usda.gov). These estimates, published by NASS every August, are a reliable benchmark mandated by the Farm Bill and in response to producer requests. Note that NASS only publishes values when survey responses are sufficient, so some counties and land types may be missing. For 2025, no estimates are available for Allegany, Anne Arundel, or Howard Counties.
Annual rental rate estimates provide essential information for landowners and tenants to understand market trends, establish fair rental rates, and make informed leasing decisions. This report presents Maryland’s cash rental rates from 2009 to 2025, with detailed tables, graphs, and maps showing state, county, and agricultural district trends.
Report Highlights:
- Maryland Cash Rental Rates (2009-2025): Includes graphs and tables showing annual state averages for non-irrigated cropland, irrigated cropland, and pastureland.
- Non-Irrigated Cropland (2016-2025): County-level averages with graphical summaries, including a map.
- Cash rental rates for irrigated land (2021-2025): County-specific data and a state-level summary of trends in irrigated land rental rates.
- Pastureland (2016-2025): County-level averages and regional trends.
Cash rent estimates can vary due to differences in soil types, yields, water access, crop history, and other unique land characteristics. Prospective tenants and landlords should stay informed about market trends, local rental norms, and broader economic factors impacting agricultural cash rents. Values in this report should be viewed as benchmarks, not exact indicators of every lease.
For questions, please visit the Grain Marketing website or Elizabeth Thilmany at thilmany@umd.edu
Maryland State Average Rental Rates (2009 to 2025)

| 2014 | 2015 | 2016 | 2017 | 2018 | 2019 | 2020 | 2021 | 2022 | 2023 | 2024 | 2025 | |
|---|---|---|---|---|---|---|---|---|---|---|---|---|
| NON-IRRIGATED | 92 | 95 | 100 | 94 | 106 | 100 | 98 | 103 | 111 | 117 | 124 | 120 |
| IRRIGATED | 143 | 175 | 190 | 196 | 194 | 197 | 201 | 212 | 225 | 227 | ||
| PASTURE | 43.5 | 45 | 40 | 44 | 48 | 53 | 51 | 50.5 | 53.50 | 59 |
State Rental Rate Trends by Cropland:
Non-Irrigated Cropland: In 2025, Maryland’s non-irrigated state average rental rate decreased by $4/acre (from $124 in 2024 to $120 in 2025), the first annual decline since COVID. Despite the lower non-irrigated rental rate in 2025, the long-run linear trend (orange dashed line) suggests continued, though slower, growth in Maryland’s non-irrigated rental rates. Updated linear trend calculations estimate that in 2026 Maryland’s non-irrigated rental rate could increase by about $3.41/acre.
Irrigated Cropland: Maryland’s irrigated rental rates rose slightly in 2025, with a $2/acre increase (from $225 in 2024 to $227 in 2025). This is well below the projected $8.12/acre increase from last year’s report, potentially indicating decreasing annual rate of increases for Maryland’s irrigated cropland.
Pastureland: State averages rose steadily, increasing about $1.27/acre annually.
In summary, reported values are not adjusted for inflation. Increases overtime may reflect both inflation and changing land demand or production costs. Annual changes beyond inflation may signal shifts in land demand, commodity prices, or input costs.
Maryland County-Level Cash Rental Rates for Non-Irrigated Land (2016-2025)
| County | Ag District | 2016 | 2017 | 2019 | 2020 | 2021 | 2022 | 2023 | 2024 | 2025 |
|---|---|---|---|---|---|---|---|---|---|---|
| Dorchester | Lower Eastern Shore | 107.00 | 108.00 | 88.50 | 91.00 | 91.00 | 79.00 | 83.00 | 108.00 | 109.00 |
| Somerset | Lower Eastern Shore | 88.50 | 76.00 | 81.50 | 81.50 | 92.00 | 102.00 | 108.00 | 89.00 | 107.00 |
| Wicomico | Lower Eastern Shore | 81.50 | 95.00 | 84.00 | 84.00 | 84.00 | 90.00 | 94.50 | 96.00 | 106.00 |
| Worcester | Lower Eastern Shore | 88.50 | 87.50 | 92.50 | 95.00 | 103.00 | 112.00 | 96.50 | 104.00 | 105.00 |
| Baltimore | North Central | 75.00 | 92.50 | 89.00 | 83.50 | 96.50 | 98.50 | 97.00 | 148.00 | 161.00 |
| Carroll | North Central | 136.00 | 106.00 | 105.00 | 99.00 | 96.00 | 132.00 | |||
| Frederick | North Central | 105.00 | 80.00 | 76.00 | 76.50 | 90.50 | 83.50 | 101.00 | 125.00 | 114.00 |
| Harford | North Central | 120.00 | 138.00 | 149.00 | 167.00 | 156.00 | 166.00 | 168.00 | 123.00 | 129.00 |
| Howard | North Central | 74.00 | 72.50 | 89.00 | 83.50 | |||||
| Montgomery | North Central | 63.00 | 49.50 | 89.00 | 83.50 | 66.50 | 84.00 | 105.00 | 113.00 | 118.00 |
| Washington | North Central | 75.00 | 88.00 | 74.50 | 80.50 | 96.00 | 85.50 | 90.50 | 119.00 | 120.00 |
| Anne Arundel | Southern | 48.50 | 43.50 | 61.00 | 51.00 | 65.00 | 69.50 | 85.00 | ||
| Calvert | Southern | 64.50 | 41.50 | 61.00 | 51.00 | 45.00 | 41.00 | 37.50 | 56.00 | 70.00 |
| Charles | Southern | 39.00 | 40.50 | 40.50 | 36.50 | 42.50 | 49.50 | 53.00 | 51.00 | 50.50 |
| Prince George's | Southern | 48.50 | 43.50 | 38.00 | 44.00 | 51.75 | 41.50 | 41.00 | ||
| St. Mary's | Southern | 45.50 | 45.00 | 51.00 | 52.00 | 58.50 | 59.50 | 45.50 | 48.50 | 46.50 |
| Caroline | Upper Eastern Shore | 110.00 | 101.00 | 101.00 | 105.00 | 112.00 | 126.00 | 117.00 | 144.00 | 137.00 |
| Cecil | Upper Eastern Shore | 94.00 | 103.00 | 103.00 | 116.00 | 138.00 | 157.00 | 155.00 | 141.00 | 134.00 |
| Kent | Upper Eastern Shore | 113.00 | 131.00 | 145.00 | 147.00 | 159.00 | 185.00 | 179.00 | 186.00 | 181.00 |
| Queen Anne's | Upper Eastern Shore | 136.00 | 125.00 | 148.00 | 136.00 | 144.00 | 168.00 | 143.00 | 169.00 | 167.00 |
| Talbot | Upper Eastern Shore | 108.00 | 102.00 | 102.00 | 110.00 | 113.00 | 113.00 | 136.00 | 134.00 | 139.00 |
| Allegany | Western | 23.50 | 58.00 | 55.50 | 28.00 | |||||
| Garrett | Western | 32.50 | 37.00 | 35.50 | 35.00 | 37.50 | 37.00 | 40.50 | 40.50 | 52.00 |
| Maryland (all Counties) Average | 100.00 | 94.00 | 100.00 | 98.00 | 103.00 | 111.00 | 117.00 | 124.00 | 120.00 | |
| Minimum | 37.00 | 37.00 | 35.50 | 28.00 | 37.50 | 37.00 | 37.50 | 40.50 | 41.00 | |
| Median | 81.50 | 88.00 | 86.25 | 87.50 | 92.00 | 90.00 | 97.00 | 116.00 | 114.00 | |
| Maximum | 136.00 | 138.00 | 149.00 | 167.00 | 159.00 | 185.00 | 179.00 | 186.00 | 181.00 |
Note: In 2024 and 2025, Kent had the highest estimated irrigated-rental rates, followed by Queen Anne’s and Baltimore County. In comparison, Prince George’s, St. Mary’s and Garrett are the three counties with reported rental rates that have had the lowest approximated non-irrigated rental rates.
2025 Maryland Non-Irrigated Land Rental Rates by County
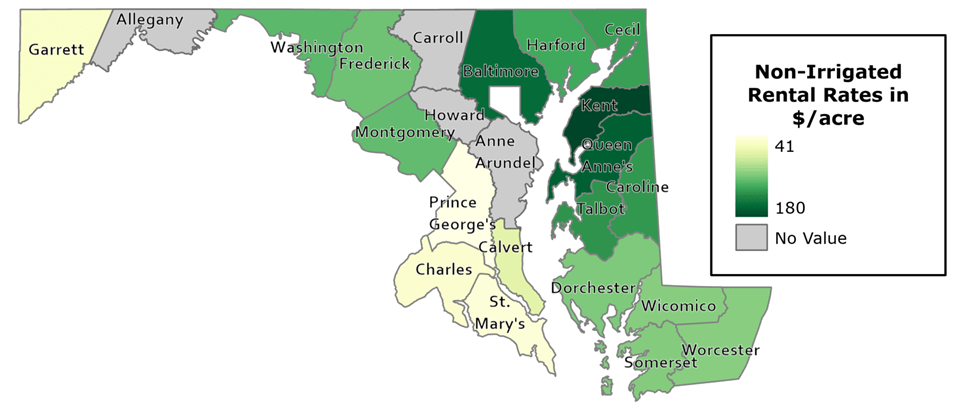
Map insights: The color gradient emphasizes the range in rental rates, from higher values in the Upper Eastern Shore (e.g., Kent County) to lower values in Southern Maryland and the Western District, represented solely by Garrett County.
The following chart illustrates Maryland’s non-irrigated rental rate trends across agricultural districts from 2008 to 2025, comparing regional values with the state average.
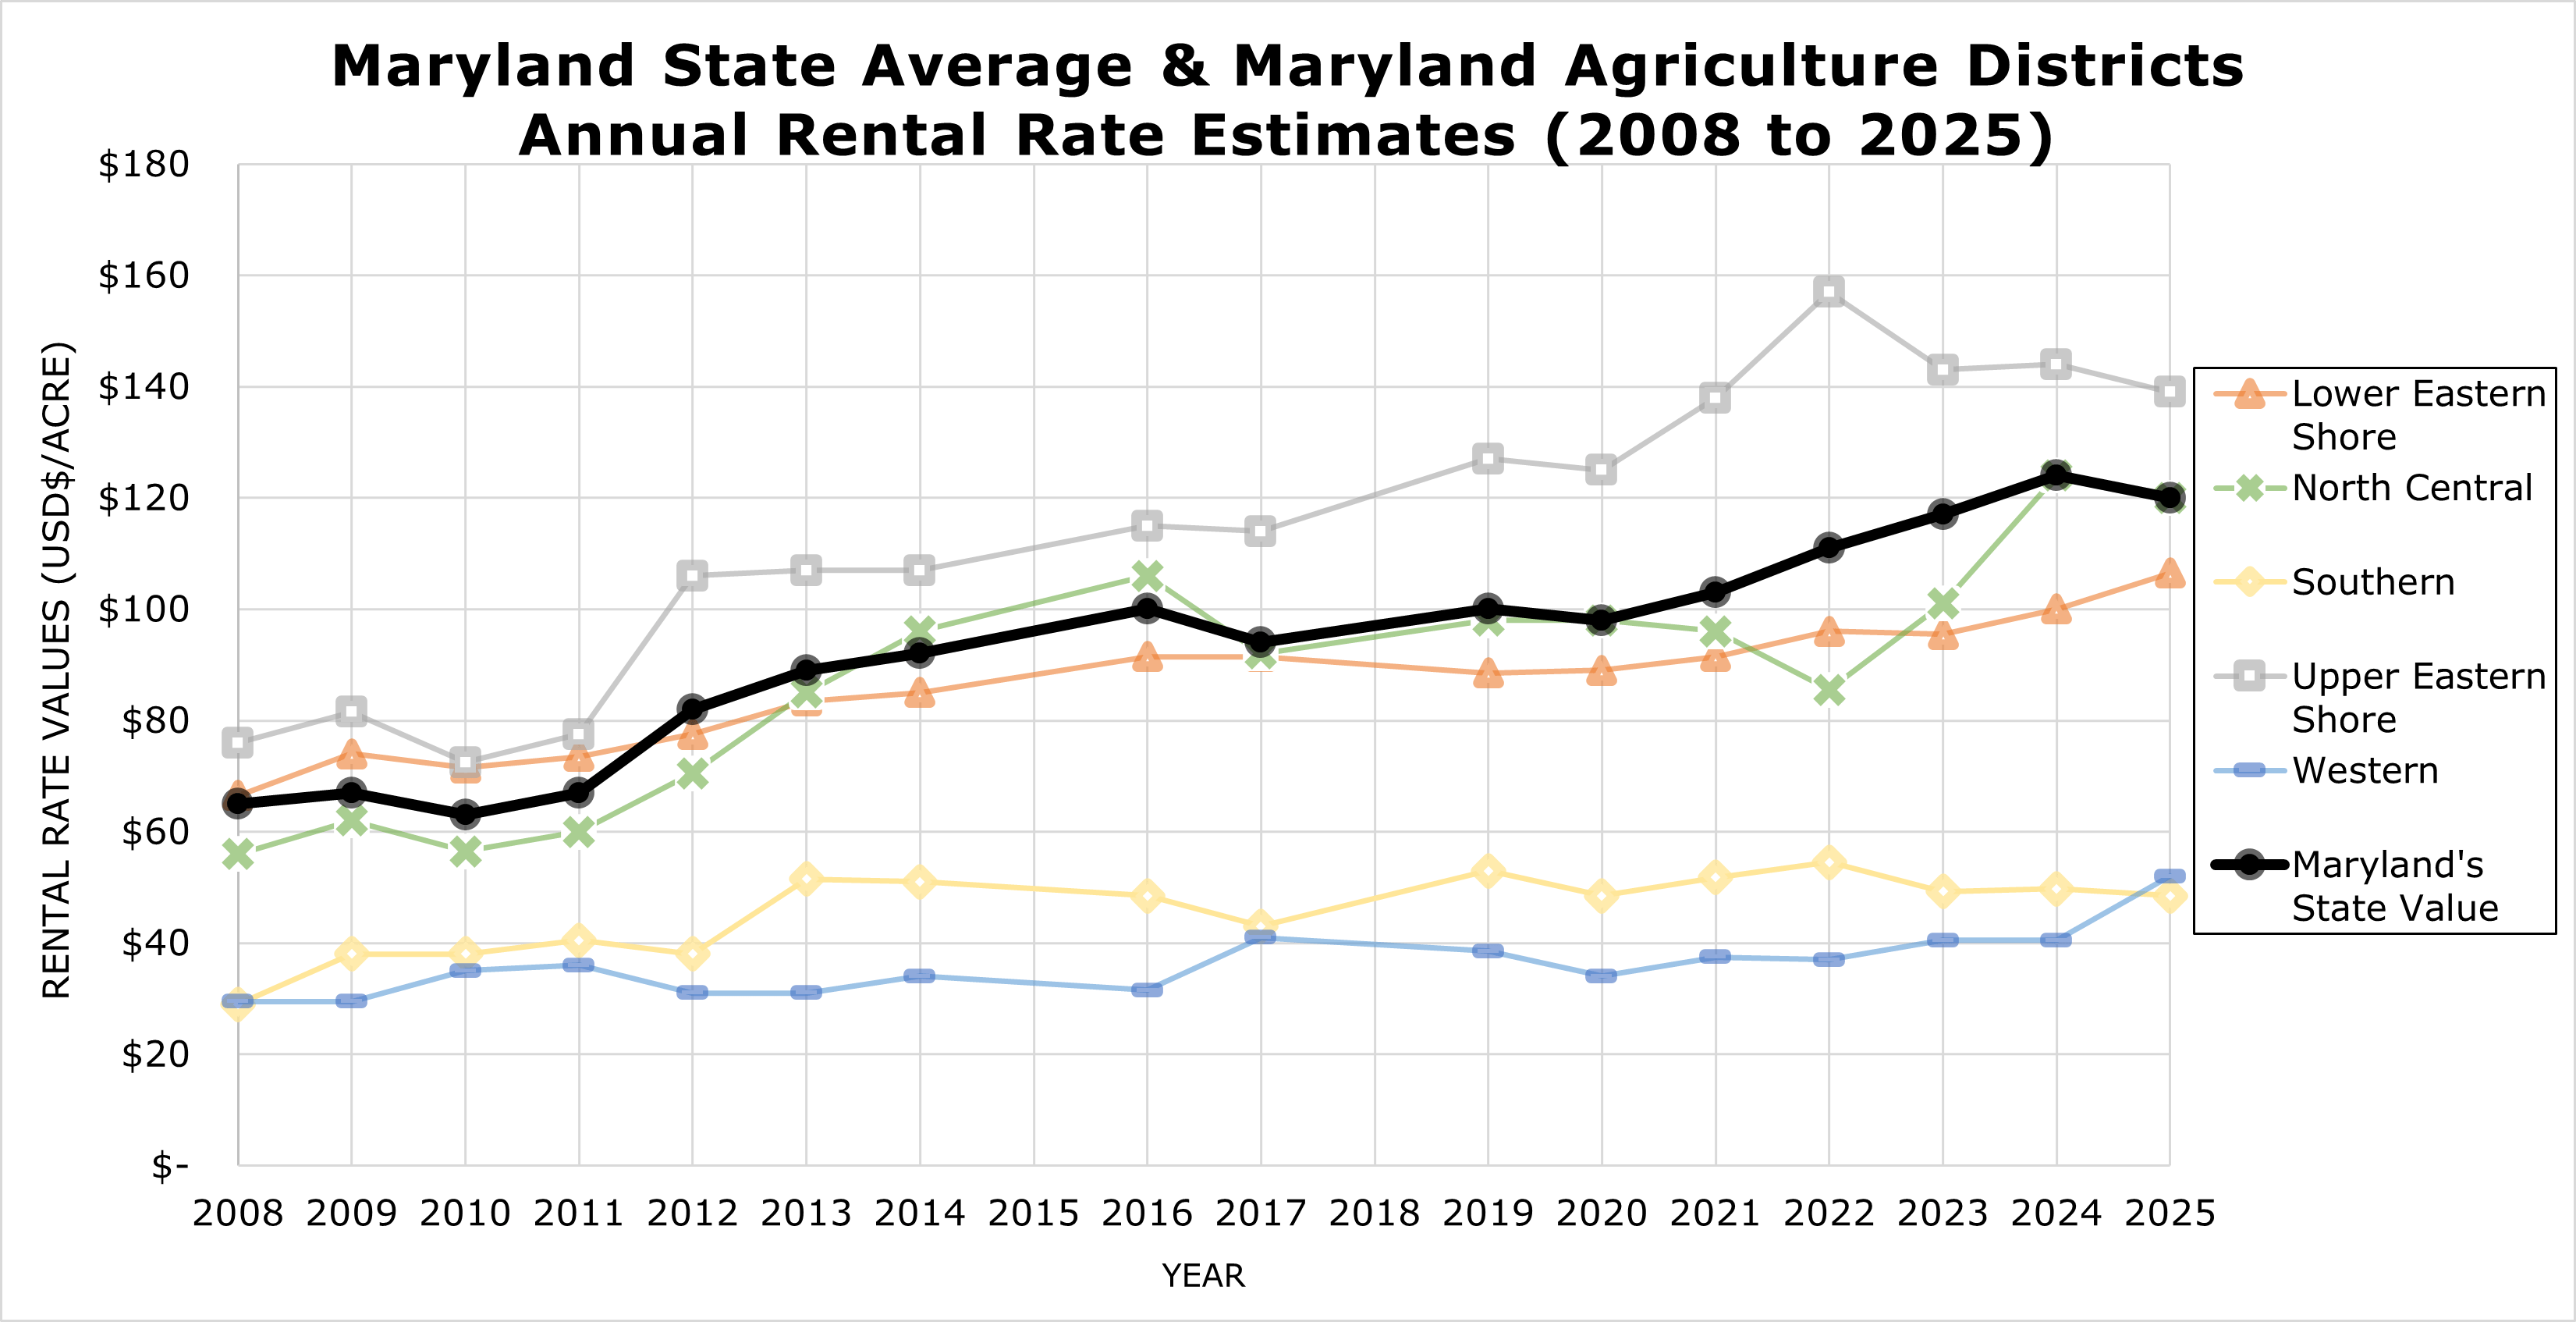
Trends to note: The Upper Eastern Shore continues to be the ag district with the highest non-irrigated rental rates above the state average, suggesting demand or productivity in that region. In contrast, Southern and Western Maryland continue to have the lowest rental rates.
Note that NASS stopped providing ag district-level estimates in 2020. Values shown above, after 2020 are the ag district’s median values, except the Western district, which only includes Garrett County and so the Western district is Garrett’s non-irrigated rental rates
Maryland Cash Rental Rates for Irrigated Land by County (2021-2025)
The table and chart below display the annual rental rates for irrigated agricultural land in Maryland counties that had statistical values published by NASS from 2021 to 2025. This comparison highlights the average state rate and the variations across counties, offering insights into regional trends and shifts in irrigated rental values.
| 2021 | 2022 | 2023 | 2024 | 2025 | |
|---|---|---|---|---|---|
| Dorchester | $199.00 | $228.00 | $227.00 | $270.00 | |
| Wicomico | $190.00 | $210.00 | $196.00 | $193.00 | |
| Caroline | $203.00 | $239.00 | $210.00 | $229.00 | |
| Kent | $164.00 | $193.00 | $224.00 | ||
| Queen Anne's | $234.00 | $208.00 | $236.00 | $250.00 | $261.00 |
| Other Counties (Starting in 2020) | $163.00 | $186.00 | $156.00 | $197.00 | $211.00 |
| Maryland State Value | $197.00 | $201.00 | $212.00 | $225.00 | $227.00 |
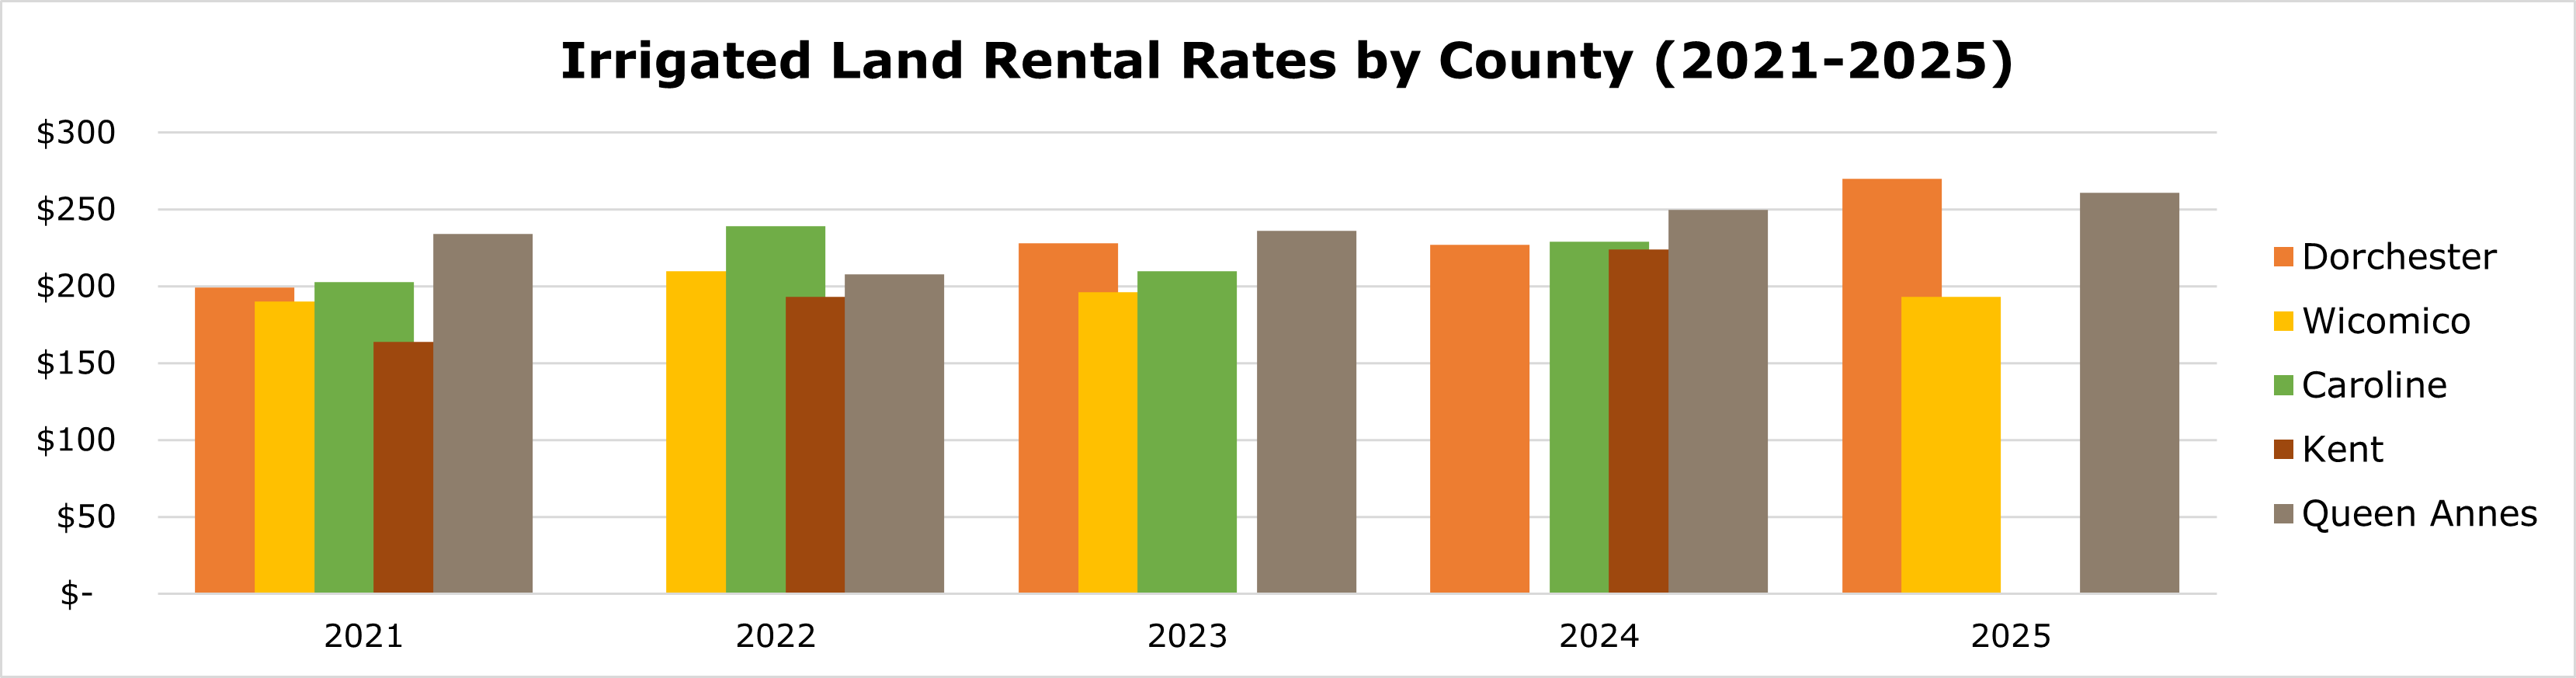
The accompanying bar chart visually compares irrigated land rental rates across the counties with published values, depicting trends in irrigated rental rates across counties (across time and between counties) from 2021 through 2025.
IRRIGATED LAND RENTAL RATES BY COUNTY (2021-2025)
Maryland Cash Rental Rates for Pastureland by County (2016-2025)
The following table includes all available NASS cash rental rates for pastureland across Maryland counties for which NASS had sufficient data to report from 2016 to 2025.
| 2016 | 2017 | 2019 | 2020 | 2021 | 2022 | 2023 | 2024 | 2025 | |
|---|---|---|---|---|---|---|---|---|---|
| Baltimore | $31.50 | $33.00 | $95.00 | $45.00 | $46.50 | $44.00 | |||
| Carroll | $26.50 | $40.00 | $47.50 | $47.50 | $56.50 | $42.00 | $62.50 | $48.00 | $63.00 |
| Frederick | $50.00 | $38.00 | $52.50 | $60.00 | $54.50 | $65.50 | $61.50 | $62.00 | $83.50 |
| Harford | $28.00 | $55.50 | $39.00 | $39.00 | $33.50 | $47.50 | |||
| Howard | $70.00 | $23.50 | |||||||
| Montgomery | $69.50 | $59.50 | $49.50 | $23.50 | $41.00 | ||||
| Kent | $62.00 | $62.50 | $117.00 | ||||||
| Washington | $57.50 | $42.00 | $41.00 | $41.00 | $42.00 | $54.50 | $53.50 | $45.00 | 52.00 |
| Allegany | $17.50 | $9.90 | |||||||
| Garrett | $25.50 | $30.00 | $21.00 | $15.00 | $32.00 | ||||
| Other Counties (Starting in 2020) | $20.00 | $68.00 | $30.00 | $45.00 | $65.50 | $52.00 | |||
| Maryland Average | $45.00 | $40.00 | $44.00 | $48.00 | $53.00 | $51.00 | $50.50 | $53.50 | $59.00 |
Note: Rates remain variable across counties, with the widest gap in 2025 between Kent ($117/acre) and Garrett ($32/acre).
2005 Maryland Pastureland land Rental Rates by County
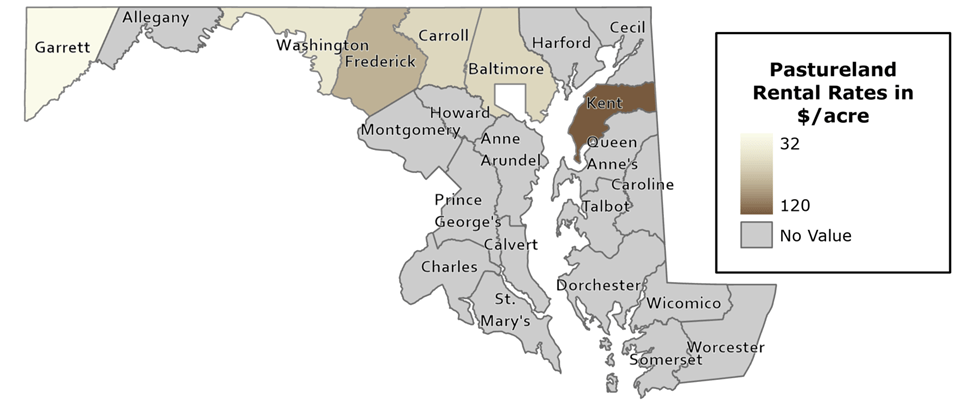
Notes from the map: The pastureland rental rates reveal notable variability, with Kent County recording the highest rental rate at $117 per acre and Garrett County the lowest at $32 per acre. Counties in gray do not have estimates from NASS for 2025, underscoring reporting limitations or insufficient sample sizes in these areas. This map offers a spatial perspective on pastureland rental rates, though localized factors affecting specific rates may not be fully represented.
-
Grain Marketing >
Grain Marketing >