
FS-2025-0792 | December 2025
Evapotranspiration and Its Importance in Precision Irrigation Water Management
By Kaustubh Shah: Graduate Student at Precision Agriculture Lab, Central Maryland Research and Education Center, University of Maryland; Cara Peterson, PhD: Postdoctoral Associate at Precision Agriculture Lab, Central Maryland Research and Education Center, University of Maryland; Hemendra Kumar, PhD: Precision Agriculture Extension Specialist, Precision Agriculture Lab, Central Maryland Research and Education Center, University of Maryland
Evapotranspiration is an important component of the hydrological cycle and a critical factor in making modern agricultural decisions, such as irrigation scheduling. It is the total amount of water lost from a given area to the atmosphere due to the combined processes of evaporation and transpiration. Given the rising demands of food production and global concerns about water conservation, farmers and agricultural planners must understand the importance of the evapotranspiration process and its role in estimating irrigation water requirements and scheduling irrigation.
What is Evapotranspiration?
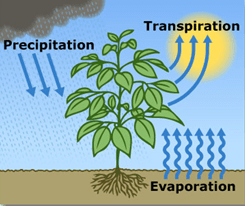
Evapotranspiration (ET) represents the total water transferred from land to the atmosphere through two processes: evaporation and transpiration. Evaporation is the process through which water transforms from a liquid into a gas in the atmosphere. Transpiration is the process through which water is absorbed by the plant roots, transported through the plant, and released into the atmosphere through the stomata in the form of water vapor (Figure 1).
In agricultural systems, understanding ET is fundamental because it represents the actual water requirement of the plants. Water is essential for plant functions, including photosynthesis and nutrient transport. Crops need an optimum amount of water to maintain growth and function. If the water loss through ET exceeds the water available to the plant in the root zone, the plant may experience water stress, and this may hinder its growth. Conversely, overcompensating for ET and supplying excess water may lead to nutrient leaching and loss in soil fertility over time. ET rate is affected by a variety of climate factors, soil properties, crop characteristics, and management practices (Table 1).
| Category | Specific Factors |
|---|---|
| Weather Parameters | Air temperature, solar radiation, wind speed, relative humidity |
| Crop Characteristics | Crop type, growth stage, canopy structure |
| Soil Properties | Soil texture, moisture content, organic matter content, surface roughness |
| Management Practices | Mulching, tillage, irrigation method, irrigation frequency |
Measuring and Estimating Evapotranspiration
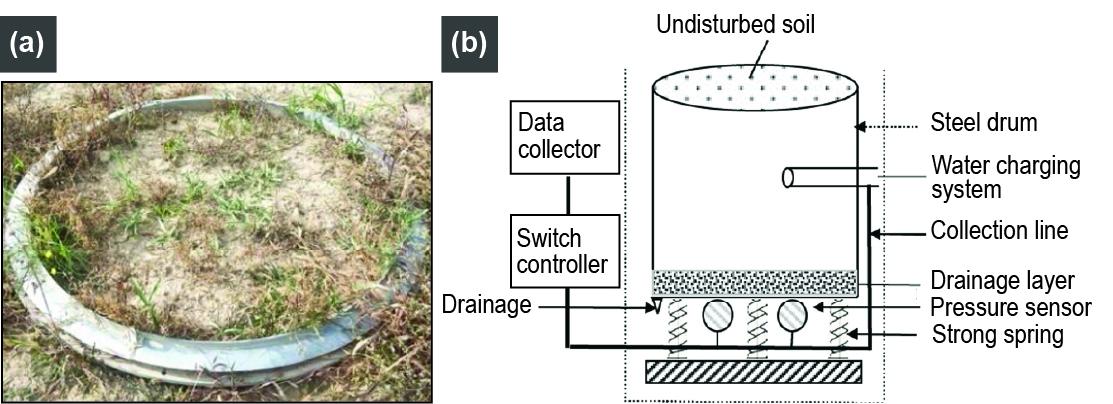
The most accurate method of measuring ET in the field is with weighing lysimeters, also called floating lysimeters (Figure 2). Typically, weighing lysimeters are constructed from large containers filled with either undisturbed soil cores or reconstructed soil cores representing the original characteristics of a soil of interest. Scientists can calculate the loss of water from the system by measuring changes in the mass of the soil core over time. Since the soil itself should remain the same weight, any changes in mass are due to changes in the water content of the soil. Whether undisturbed or reconstructed, the soil core sample is taken from the crop root zone to accurately measure soil water relevant to plant uptake.
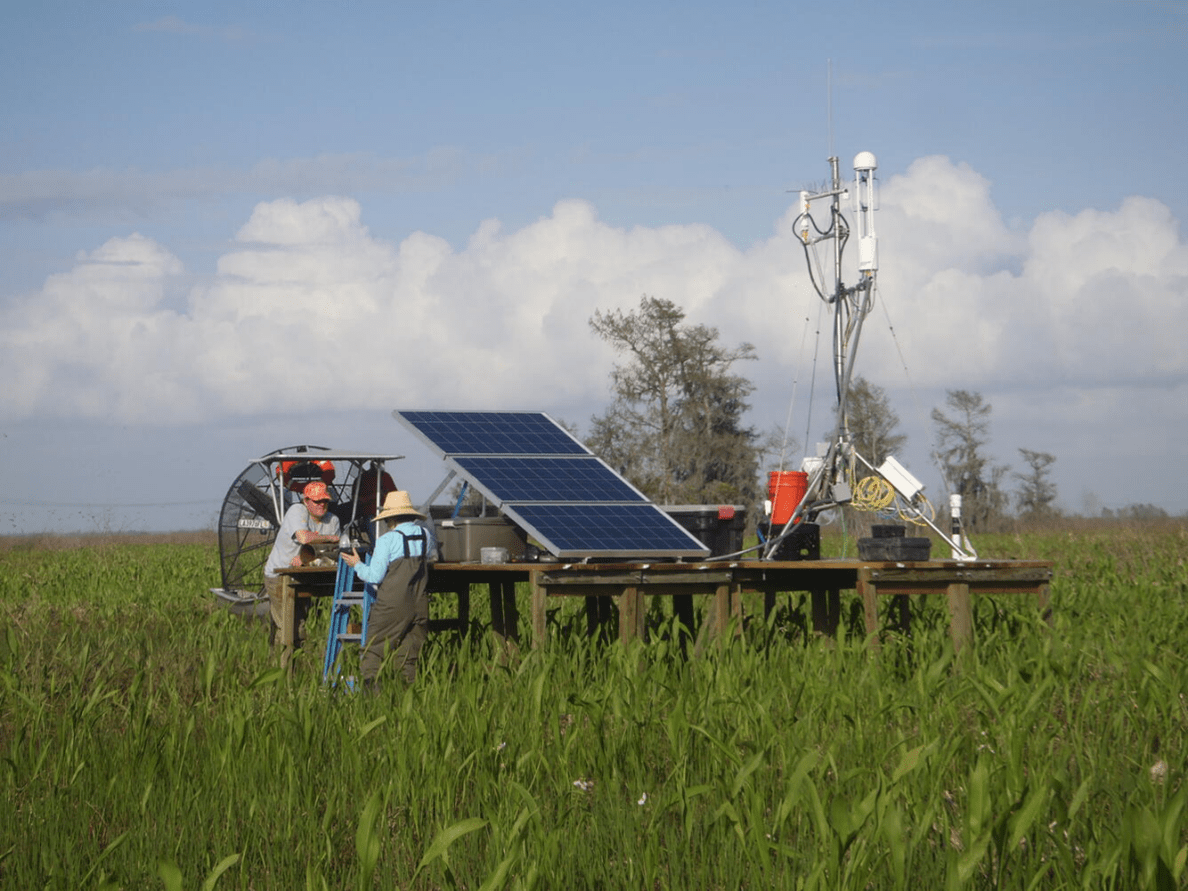
Similarly, we can estimate ET using eddy covariance towers, which are field-based systems that directly measure the exchange of water vapor between the field and the atmosphere. Sensors affixed to metal structures typically 2-10 m tall to collect temperature, humidity, and wind speed data, which is then used to estimate the amount of water that has evaporated from the area.
ET can also be estimated using the Penman-Monteith equation for irrigation scheduling at the field scale as recommended in the Food and Agriculture Organization’s Irrigation and Drainage Paper No. 56 (Allen et al.,1998). The Penman-Monteith equation is used to compute a quantity known as reference evapotranspiration (ETo), which is the evapotranspiration of a reference crop, such as alfalfa or well-watered grass. Inputs for the equation include air temperature, relative humidity, wind speed, and solar radiation. Once the reference evapotranspiration (ETo) is computed, it can be converted into crop evapotranspiration. Crop evapotranspiration (ETc) is the water loss from a specific crop (e.g., corn, soybean, etc.) under optimal conditions of ample water supply and well-fertilized, disease-free soil. The following equation is used to convert reference ETo to ETc:
ETc = Kc * ETo (Eq. 1)
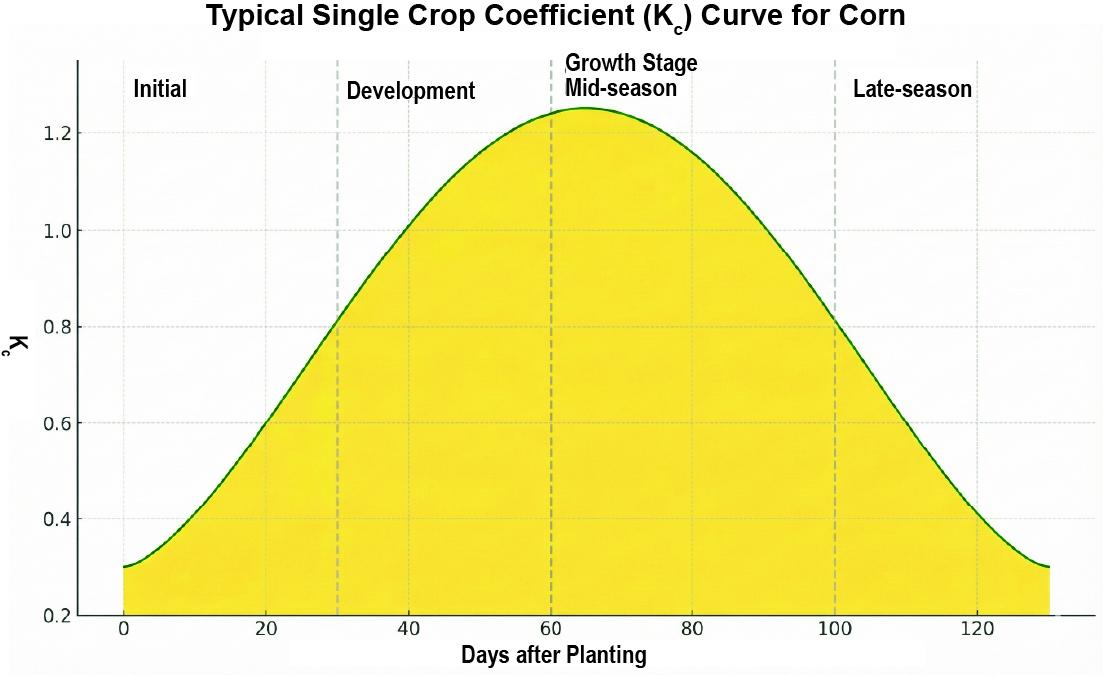
where ETc is crop ET and Kc is the crop coefficient, or the factor by which the presence of a specific crop changes how much water is lost from the system. Kc values are typically found in reference tables for different crops and their growth stages. Kc changes depending on local weather conditions, soil evaporation, and crop growth stage. In the early stages of crop growth, Kc is low because the plants are small and do not cover much of the soil surface. As the crop progresses through vegetative growth, Kc increases and then peaks when the crop canopy has fully developed. Then, if the crop is allowed to reach maturity, such as is the case for corn, soybean, or fruits such as melons, the Kc value decreases as the crop leaves wither and the crop canopy becomes sparse.
| Crop | Kc (initial) | Kc (mid) | Kc (end) |
|---|---|---|---|
| Field Corn | 0.3 | 1.20 | 0.35-0.60 |
| Sweet Corn | 0.3 | 1.15 | 1.05 |
| Soybean | 0.4 | 1.15 | 0.50 |
| Winter wheat | 0.4 (frozen soil), 0.7 (non-frozen soil) | 1.15 | 0.25-0.4 |
| Tomato | 0.6 | 1.15 | 0.70-0.90 |
| Watermelon | 0.4 | 1.00 | 0.75 |
Dual Crop Coefficient
In the single crop coefficient approach (using only Kc in Equation 1), Kc represents both the effect of crop transpiration and soil evaporation. However, the soil evaporation rate is subject to change based on the amount of sunlight, the amount of rainfall, and the applied irrigation. Therefore, Kc expresses a time-average effect of crop evapotranspiration and is commonly used in systems with longer irrigation intervals (seven to ten days), such as furrow, basin, or surface irrigation.
To calculate the irrigation requirements for high-frequency irrigation systems such as drip and center pivot, it is better to use the dual crop coefficient. In this method, plant transpiration and soil evaporation are represented by separate coefficients: Kcb for plant transpiration and Ke for soil evaporation. Kc in the dual coefficient method is described as:
Kc = Kcb + Ke (Eq. 2)
where Kcb is the basal crop coefficient (the single value crop coefficient found in reference tables, Kc in Equation 1), and Ke is the soil water evaporation coefficient as determined by soil water balance. The value of Ke is 1 when the surface is wet from irrigation or rainfall and decreases to zero as the surface dries.
Example of calculating ET꜀
Here is an example of calculating the ETc of the field corn during the middle of the growing season.
Given:
- ETo = 5.88 mm/day
- Kc (mid-season corn) = 1.20 (Allen et al.,1998)
Using Equation (1):
ETc= ETo* Kc
ETc = 5.88*1.20 mm/day
ETc = 7.05 mm/day
Therefore, the daily crop water requirement is 7.05 mm per day for a corn crop in the middle of the growing season.
Calculating Irrigation Scheduling Using ET꜀
To maintain healthy crop growth, the irrigation schedule should replenish the water lost through ETc.
STEP 1: Determine Irrigation Interval
Given:
- No significant rainfall during the period.
- The soil has an available water-holding capacity (AWC) of 50 mm in the root zone (e.g., for a medium-textured soil).
- The allowable depletion is 50%, so we can use up to 25 mm before irrigating.
Based on calculated ETc:
Irrigation Interval = Allowable depletion ÷ ETc = 25 mm ÷ 7.05 mm/day = 3.54 = 4 days
Therefore, irrigation should be applied every 4 days during the mid-growing season
STEP 2: Calculate irrigation Depth
Irrigation Depth = 7.05 mm (daily crop water requirement) *4 days = 28.2 mm total.
Convert millimeters to inches: 28.2 mm ÷ 25.4 =1.11 inches
1.11 inches of water should be applied every 4 days
Conclusion
Evapotranspiration reflects the actual water demand of crops through the combination of evaporation and transpiration processes. By estimating the crop ET, we can determine the amount of water required to meet the needs of the crop without causing water stress or waste.
Effective irrigation scheduling based on ETc enables farmers to:
- Apply the right amount of water at the right time
- Conserve valuable water resources
- Enhance crop yield and quality
- Adapt to increasingly variable climatic conditions.
As climatic instability and water shortages become more problematic, incorporating ET-based irrigation techniques will be essential to maintaining food security, minimizing environmental effects, and encouraging effective water management in agriculture.
Acknowledgement
This publication is supported by the funding from USDA Natural Resources Conservation Service.
Correspondence:
Hemendra Kumar, PhD.
Precision Agriculture Extension Specialist,
Precision Agriculture Lab,
College of Agriculture and Natural Resources,
University of Maryland
hemendra@umd.edu
References
Allen, R. G., Pereira, L. S., Raes, D., & Smith, M. (1998). Crop evapotranspiration: Guidelines for computing crop water requirements (FAO Irrigation and Drainage Paper No. 56). Food and Agriculture Organization.
Allen, R. G., Pereira, L. S., Smith, M., Raes, D., & Wright, J. L. (2005). FAO 56 dual crop coefficient method for estimating evaporation from soil and application extensions. Journal of Irrigation and Drainage Engineering, 131(1), 2–13. https://doi.org/10.1061/(ASCE)0733-9437(2005)131:1(2)
Doorenbos, J., & Pruitt, W. O. (1977). Guidelines for predicting crop water requirements (FAO Irrigation and Drainage Paper No. 24). Food and Agriculture Organization.
Doorenbos, J., Pruitt, W. O., & Bray, D. W. (1979). Crop water requirements – A FAO perspective (FAO Irrigation and Drainage Paper No. 24). Food and Agriculture Organization.
Lhomme, J. P., Boudhina, N., Masmoudi, M. M., & Chehbouni, A. (2015). Estimation of crop water requirements: Extending the one step approach to dual crop coefficients. Hydrology and Earth System Sciences, 19, 3287– 3299. https://doi.org/10.5194/hess-19-3287-2015
USDA Agricultural Research Service. (2014). Assessing FAO 56 dual crop coefficients using eddy covariance (ARS User Provided Report). https://www.ars.usda.gov
U.S. Geological Survey. Evapotranspiration: The sum of plant transpiration and evaporation. U.S. Department of the Interior. https://www.usgs.gov/media/images/evapotranspiration-sum-plant-transpiration-and-evaporation
Zhang, Q., Wang, S., Yue, P., & Wang, R. (2019). A measurement, quantitative identification and estimation method (QINRW) of non-rainfall water component by lysimeter. MethodsX, 6, 2873–2881. https://doi.org/10.1016/j.mex.2019.11.012
KAUSTUBH SHAH
CARA PETERSON, PH.D.
HEMENDRA KUMAR, PH.D.
hemendra@umd.edu
This publication, Evapotranspiration and Its Importance in Precision Irrigation Water Management (FS-2025-0792), is a part of a collection produced by the University of Maryland Extension within the College of Agriculture and Natural Resources.
The information presented has met UME peer-review standards, including internal and external technical review. For help accessing this or any UME publication, contact: itaccessibility@umd.edu
For more information on this and other topics, visit the University of Maryland Extension website at extension.umd.edu
University programs, activities, and facilities are available to all without regard to race, color, sex, gender identity or expression, sexual orientation, marital status, age, national origin, political affiliation, physical or mental disability, religion, protected veteran status, genetic information, personal appearance, or any other legally protected class.
When citing this publication, please use the suggested format:
Shah, K, Peterson, C., & Kumar, H. (2025). Evapotranspiration and Its Importance in Precision Irrigation Water Management (FS-2025-0792). University of Maryland Extension. go.umd.edu/FS-2025-0792.