
EB-455 | December 2021
Solar Panels are an Increasingly Common Sight on Urban and Rural Properties Across Maryland
In this report, we explore the historical trends, current status, and potential growth of Maryland’s solar photovoltaic (PV) market in terms of market share, use sectors, and current investments. We also address the deployment capacity and market potential for residential, commercial, and utility-scale sectors within Maryland. Various solar initiatives, legislation, and other enabling policies currently impacting the solar market are also discussed.
Solar PV is considered a mature technology with large investments and broad adoption across the United States and in Maryland. Solar PV generation, particularly at the utility scale, is now growing at a faster rate, and with higher generation, than distributed electrical. Electricity generated from renewables, including solar PV, is expected to further increase due to declining costs of the renewable capacity, making these renewable fuels increasingly competitive (Figure 1).

A Brief History of Solar Photovoltaics (PV)
In 1839, Alexander Becquerel found that electrons would flow as light hit a piece of metal. The concept was not well understood until Bell Labs, now AT&T Labs, produced the first PV cell or silicon solar cell in the 1950s. While PV was briefly considered for rural U.S. electricity production, the technology remained cost prohibitive for many practical applications. In the late 1950s, U.S. defense programs looked at PV for energy in orbiting satellites in the space program, with the first commercial use of PV on the Vanguard 1 satellite in 1958.
By the early 1970s, there were over 1,000 solar-powered satellites. At that time, crystalline silicon PV cells cost around $76 per watt (Arafa and Said, 2019; Rodziewicz et al., 2016). The costs decreased slightly throughout the 1970s when PV found wider application in remote operations without electricity, such as railroad crossings and road signs. This cost reduction has generally followed Swanson’s Law, which states that the price of solar drops by 20% for every doubling of shipped product. Crystalline silicon PV cells currently cost around $0.30 per watt (Arafa and Said, 2019).
Modern PV manufacturing further matured with improvements in efficiency, as well as the invention of related technologies such as inverters and standardized components. While these advancements helped improve the compatibility of solar PV with the electrical grid system, the U.S. oil crisis spurred further research and attention on solar PV in the late 1970s. The Carter administration established the Solar Energy Research Institute in 1977 under the U.S. Department of Energy.
Small, low-powered solar cells found wider applications in handheld devices like calculators and watches in the 1980s. PV prices continued to drop through the 1980s and 1990s as U.S. production increased. California led the country, while Germany and Japan led adoption of large-scale PV since the 1990s. China’s subsequent rise
in the solar energy sector began due to progressive renewable energy policies in Europe through the 1990s. These policies created significant demand for PV panels in the European Union which was met by China using its competitive advantage in manufacturing. China surpassed Germany in 2015 to become the country with the highest installed solar capacity in the world, with 204.7 GW installed by the end of 2019 (IEA, 2020). Figure 2 shows a brief timeline of solar PV development.

Market Share and Growth
Approximately 61% of electricity use in the world is currently generated from fossil fuels, 10% from nuclear sources, and the remaining 29% coming from renewables (see Figure 3). Of this renewable portion, roughly 16% is derived from hydroelectric, or hydropower, while 3% is from solar PV (EIA, 2021c). While hydropower currently forms a larger portion of our renewable energy portfolio in terms of electrical generation, solar PV is one of the largest growth areas.
Since 2006, annual PV growth has grown exponentially (Figure 4). While there was a global recession during 2009-2011, solar PV continued to increase employment, capacity, and total installations each year. While the COVID-19 pandemic has impacted the solar industry in each country to varying extents, the United States had a record 19.2 gigawatts of new capacity added in 2020, a 43% jump from 2019 (Wood Mackenzie, 2021). By early 2021, the solar industry estimated about 760 gigawatts (GW) of solar PV were installed globally, representing a 3.0% share of total electricity consumption (REN21, 2021). Using an average amount of sunlight and external efficiency numbers, this conservatively amounts to over 800 terawatt-hours per year of solar electricity. By 2030, U.S. solar installations are expected to quadruple from current levels (Wood Mackenzie, 2021).


U.S. capacity of solar PV is also increasing each quarter with rather large fourth quarter changes each year, particularly in the utility sector (Figure 5). Solar farms, or utility-based installations for large, centralized generation are commonly considered the utility sector.
While solar PV is increasing nationally, hydroelectric power has remained relatively stagnant due to the fairly consistent number of hydroelectric facilities, as well as limited geographic availability for hydropower operations (Figure 6). The relative share of electricity generated from solar PV is increasing compared to hydropower and other renewables.
Maryland’s annual solar installations have shown similar trends (Figure 7), with the same spike in 2016 attributed to the utility-scale segment bolstered by projects initially hedging against extension of the Federal Investment Tax Credit. In line with national trends, Maryland’s net electricity generation is also becoming less dependent on fossil fuels, with solar PV experiencing rapid growth since 2013 (Figure 8).


While California remained a strong leader in PV growth for many years, the ranking of many other states fluctuated due to changing legislative and financial metrics (Figure 9). Maryland’s ranking, for instance, fluctuated between 10th and 17th since 2012. Table 1 shows Maryland’s ranking based on data through 2020. The financial and legislative changes impacting these rankings are a combination of net metering rules, state and local incentives, and/or private development. For Maryland, incentives have largely come from the state’s Renewable Portfolio Standard (RPS), as well as some other state incentives, including those which have led to large utility-scale installations.
| RANK | STATE | MW INSTALLED | NUMBER OF INSTALLATIONS | NUMBER OF SOLAR JOBS |
|---|---|---|---|---|
| 1 | California | 32,393.00 | 1,339,965 | 68,677 |
| 2 | Texas | 11,062.80 | 125,003 | 10,088 |
| 3 | North Carolina | 7,228.40 | 24,291 | 6,107 |
| 4 | Florida | 7,680.90 | 99,530 | 11,219 |
| 5 | Arizona | 6,111.70 | 191,900 | 7,346 |
| 6 | Nevada | 4,209.10 | 71,460 | 6,174 |
| 7 | New Jersey | 3,739.30 | 140,749 | 5,384 |
| 8 | Massachusetts | 3,380.60 | 118,273 | 9,495 |
| 9 | Georgia | 3,248.60 | 3,425 | 4,466 |
| 10 | New York | 2,989.90 | 149,041 | 10,214 |
| 11 | Virginia | 2,629.00 | 19,797 | 4,312 |
| 12 | Utah | 2,456.90 | 52,658 | 6,926 |
| 13 | South Carolina | 1,902.60 | 24,564 | 3,086 |
| 14 | Colorado | 1,791.90 | 85,757 | 6,771 |
| 15 | Minnesota | 1,617.60 | 9,596 | 3,993 |
| 16 | Hawaii | 1,441.00 | 94,408 | 2,365 |
| 17 | Maryland | 1,376.70 | 76,172 | 4,565 |
| 18 | New Mexico | 1,231.40 | 32,530 | 1,880 |
| 19 | Oregon | 1,172.00 | 24,920 | 3,502 |
| 20 | Connecticut | 952.70 | 57,468 | 2,126 |

Many Reasons for Global, National, and Maryland’s Market Growth of Solar PV
In some developing countries and in U.S. rural areas, access to traditional energy sources may be limited. The need for reliable energy throughout much of sub-Saharan Africa, for example, cannot be met by limited fossil resources. In these cases, rural electrification may spur solar PV development over more traditional fuels.
Likewise, grid-connected utilities may be cost-prohibitive or unavailable to some rural and remote areas within Maryland, including agricultural sites which may have distant farm structures or isolated equipment needing electrical power. In addition to practical need for electricity in remote locations, various economic and policy-based factors are driving the development of solar PV.
Economic Drivers
In recent years, solar has become much more cost competitive with traditional energy sources. Solar now has grid parity (equal to the cost) with fossil fuels. In over 30 countries, PV technologies are already less expensive than traditional electrical counterparts and can be profitable without additional financial incentive support. This is particularly true in countries where traditional electricity production is very expensive because of high fuel or distribution costs.
PV costs are exponentially declining as materials and manufacturing efficiencies improve (Figure 10).
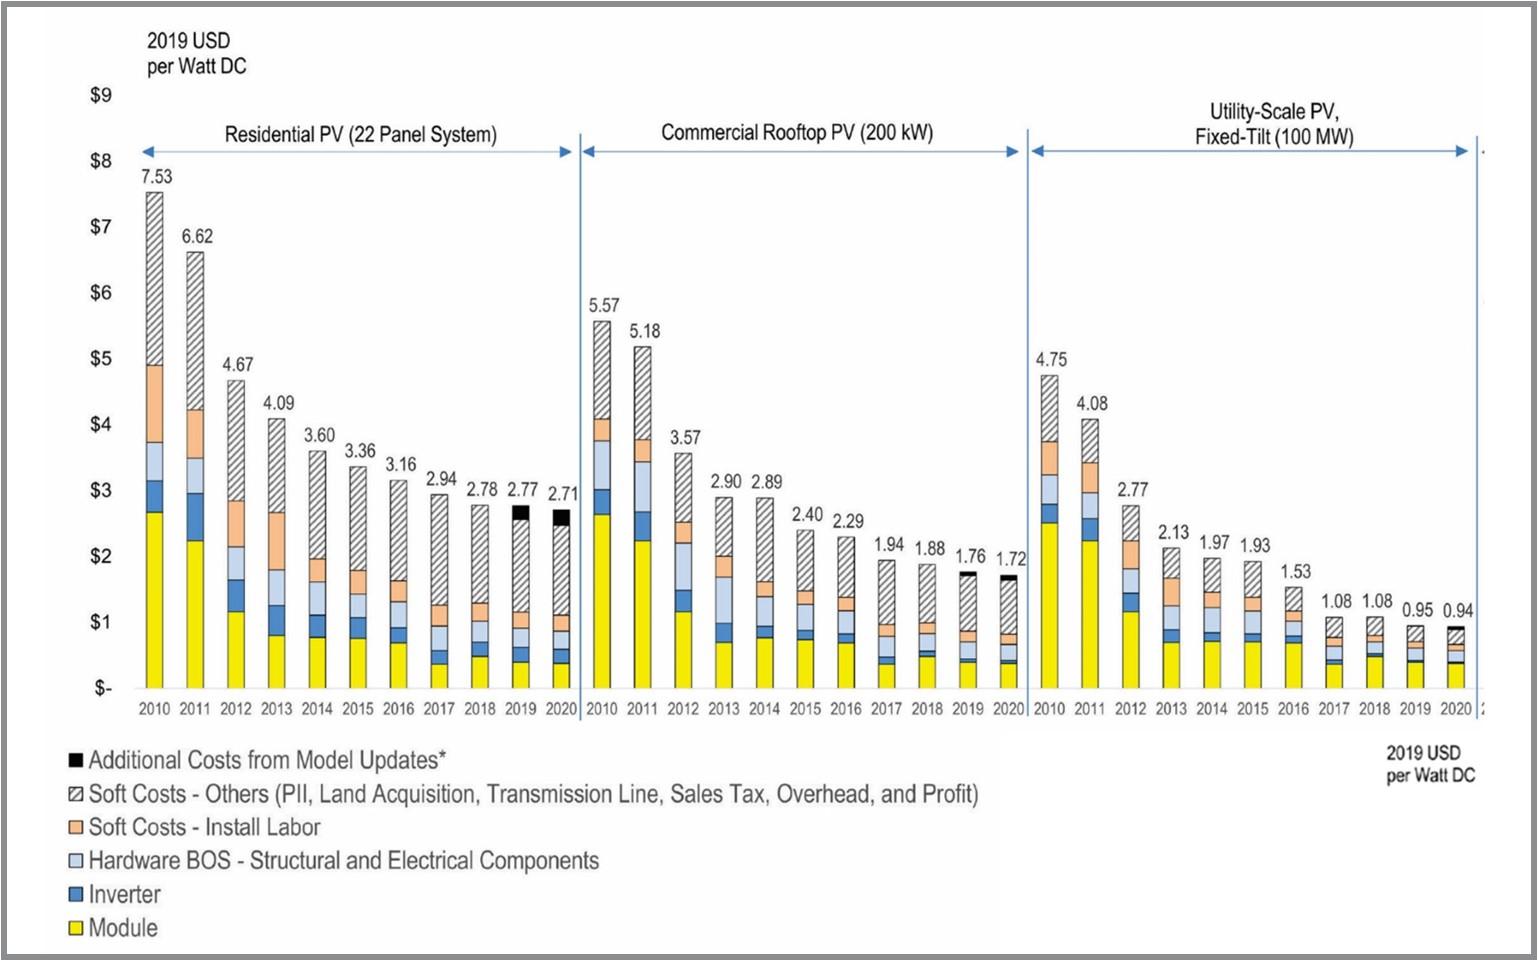
Major supply increases, like raw materials of silicon in the mid-2000s, led to a sharp decrease in the cost of manufacturing. From 2010 to 2020, there was a 64%, 69%, and 82% reduction in the residential, commercial rooftop, and utility-scale (one-axis) PV system cost benchmark, respectively. A significant portion of these reductions can be attributed to total hardware costs (module, inverter, and hardware balance of system [BOS]), with module prices dropping 85% over that period (Feldman et al., 2021). As a result, the share of unavoidable soft costs, such as utility integration and permitting, have risen to about 20% of the total system costs depending on system design, size, and location.
Solar PV may also be cost-competitive with many conventional technologies when accounting for levelized costs (Figure 11). Levelized cost allows us to compare different methods of electricity generation on a consistent basis by measuring the average net present cost of electricity generation for a power plant over its lifetime. This investment planning tool takes into account the cost of maintenance and operation, as well as fuel and technology.
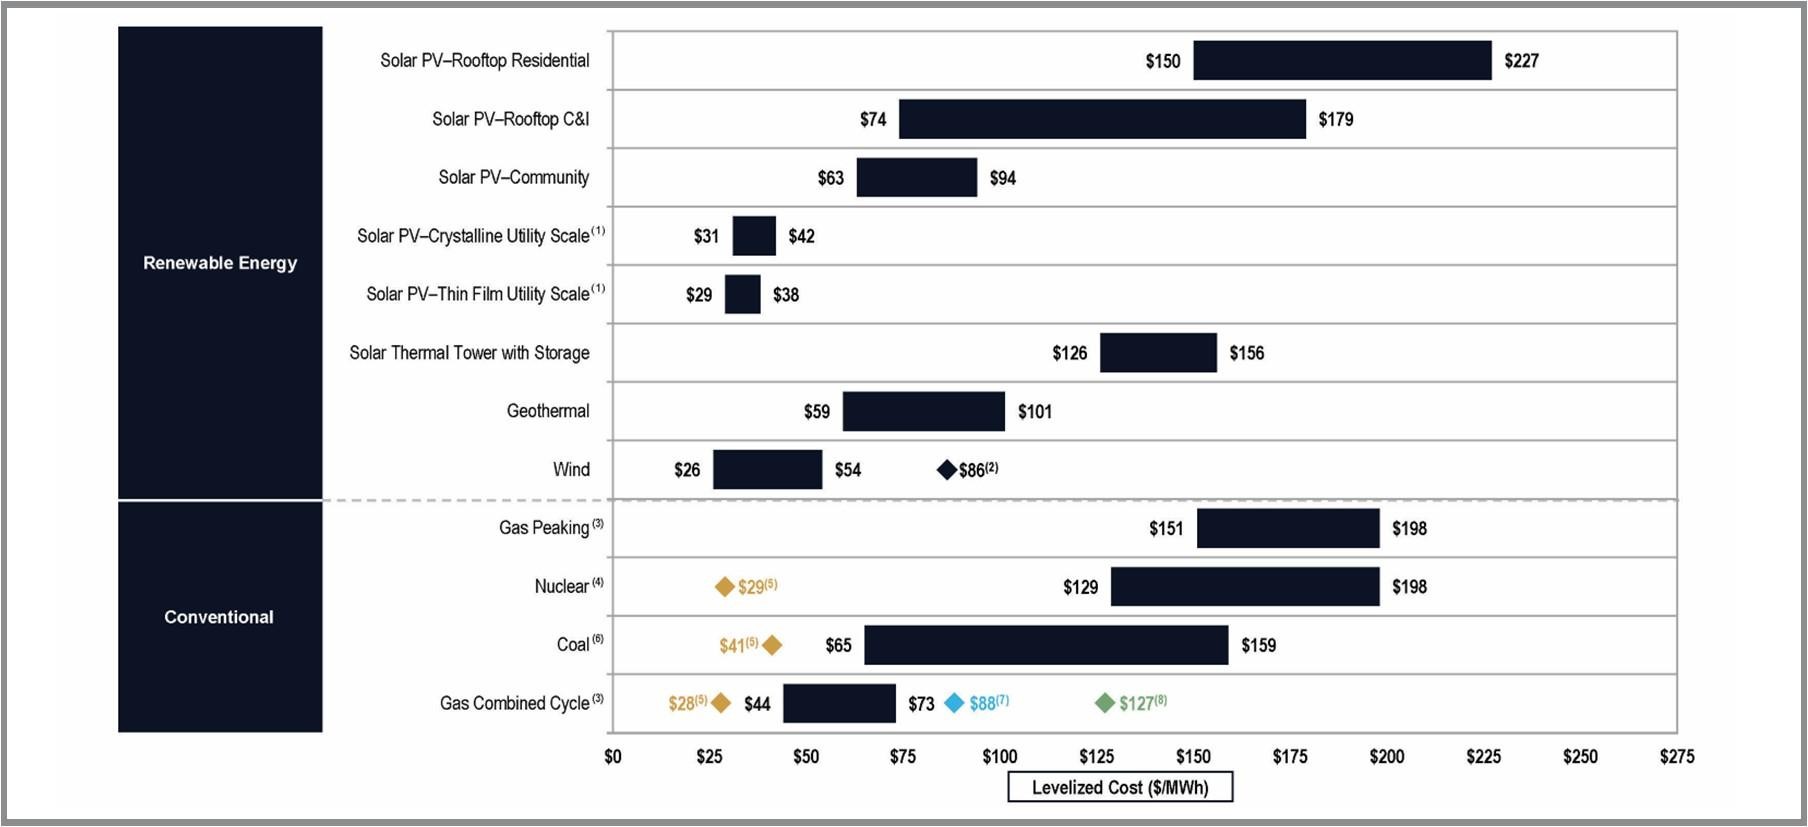
Conventional energy sources, like natural gas, coal, and nuclear, have significant operation and maintenance costs, as well as fuel costs. With PV, the fuel (sunlight) is free and there are limited operation or maintenance costs. While solar PV may have a higher installation cost per energy unit, renewable energy systems like PV become strong contenders when considering the lifetime of the technology.
Policy Drivers
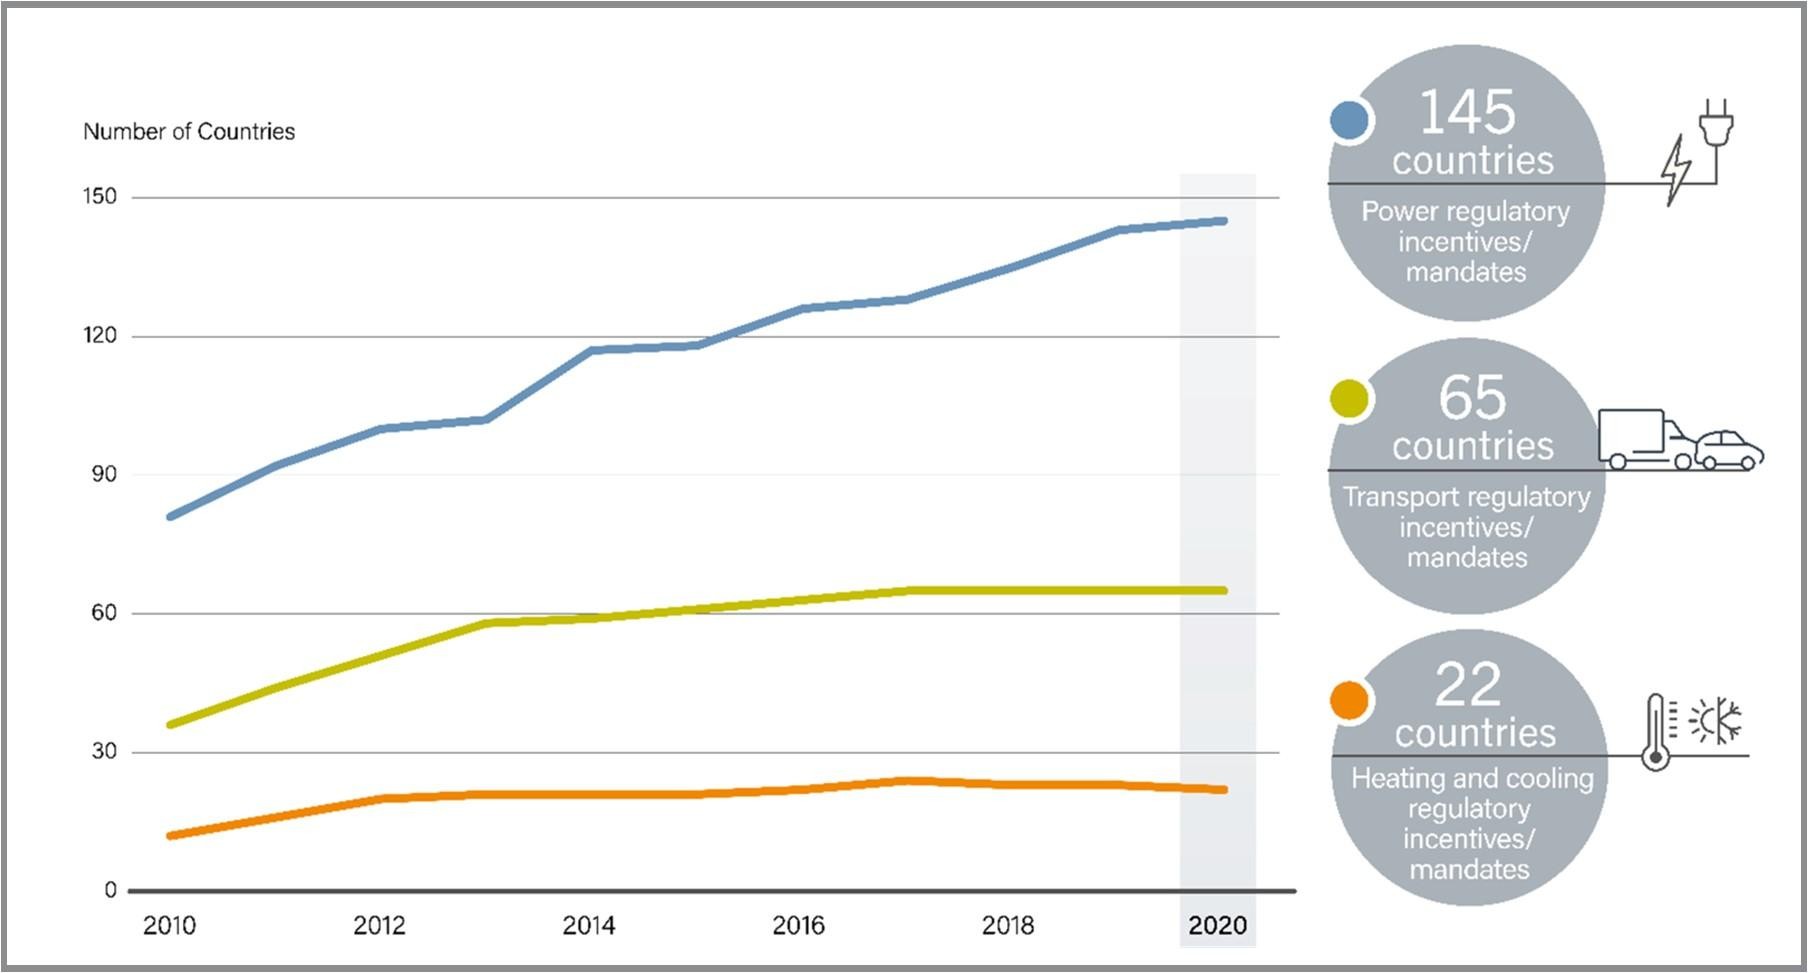
Figure 12 shows the growing number of countries with renewable energy policies. When national and NGO programs incentivize solar PV installations and trainings, they usually include some financial measures to support more affordable solar PV. While large portions of Europe and Asia have national renewable energy policies, the United States has only implemented various state-level requirements.
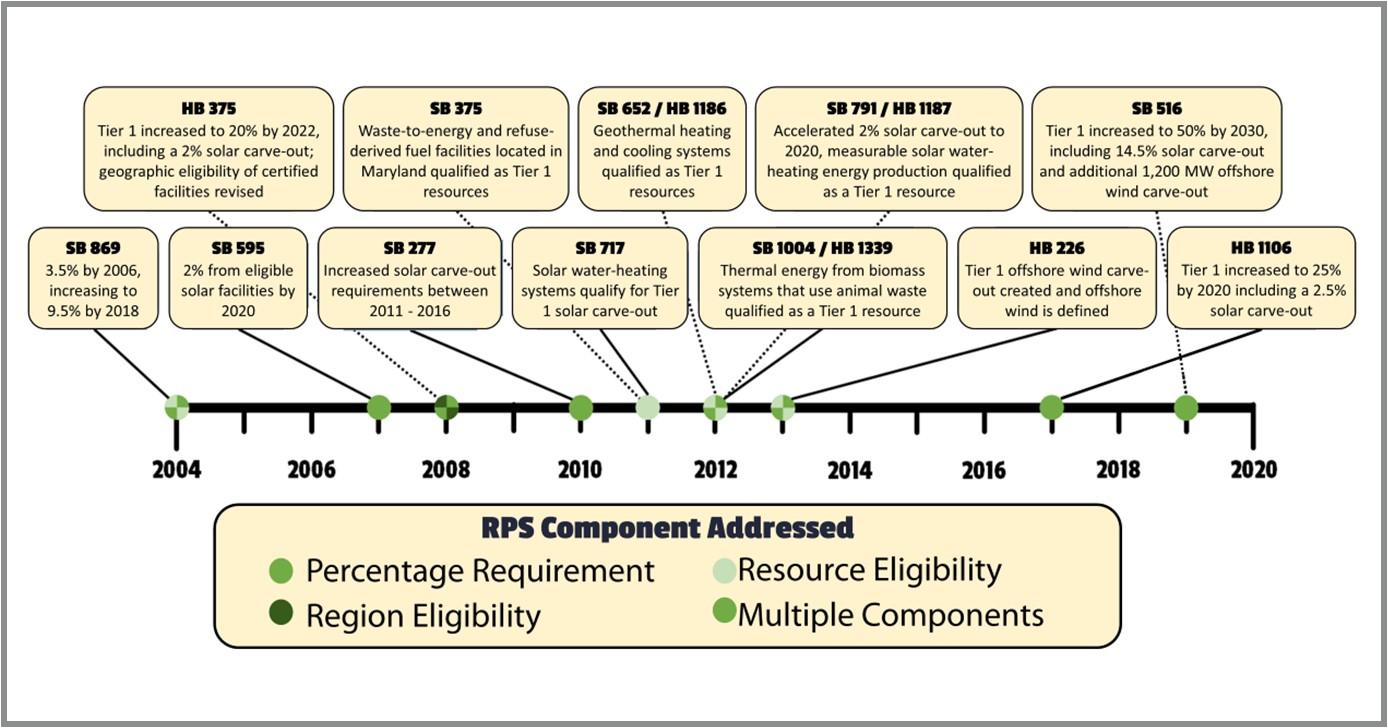
Like many other states (Figure 13), Maryland has given priority to renewable energy sources, with the state's legislature enacting a renewable portfolio standard (RPS) in 2004. Maryland has amended the RPS several times (Figure 14). The latest update in May 2019 requires 50% of the state's electricity retail sales from renewable sources by 2030. The update also requires 14.5% of an electricity supplier's retail sales from solar power by 2030. The state's offshore wind generating capacity must reach 400 megawatts (MW) in 2026 and increase to at least 1,200 MW by 2030. See Maryland Public Utilities Code Ann. §7-701 (2018) and Maryland Senate Bill 516 (2019) for more information.

The RPS requires a certain percentage of the energy sold by each utility to come from renewable sources. Utilities and retail suppliers measure their compliance with the RPS using Renewable Energy Certificates (RECs), which are created when renewable sources generate electricity (one megawatt-hour of electrical generation
equals one REC). RECs represent the environmental value of renewable energy, while adding a secondary revenue stream for investments since RECs can be bought and sold. RECs initially belong to whoever owns the renewable energy system, giving them the legal right to claim the use of the corresponding renewable energy. This right is valuable to utilities in terms of meeting Maryland’s RPS, as well as businesses interested in claiming the use of that renewable energy.
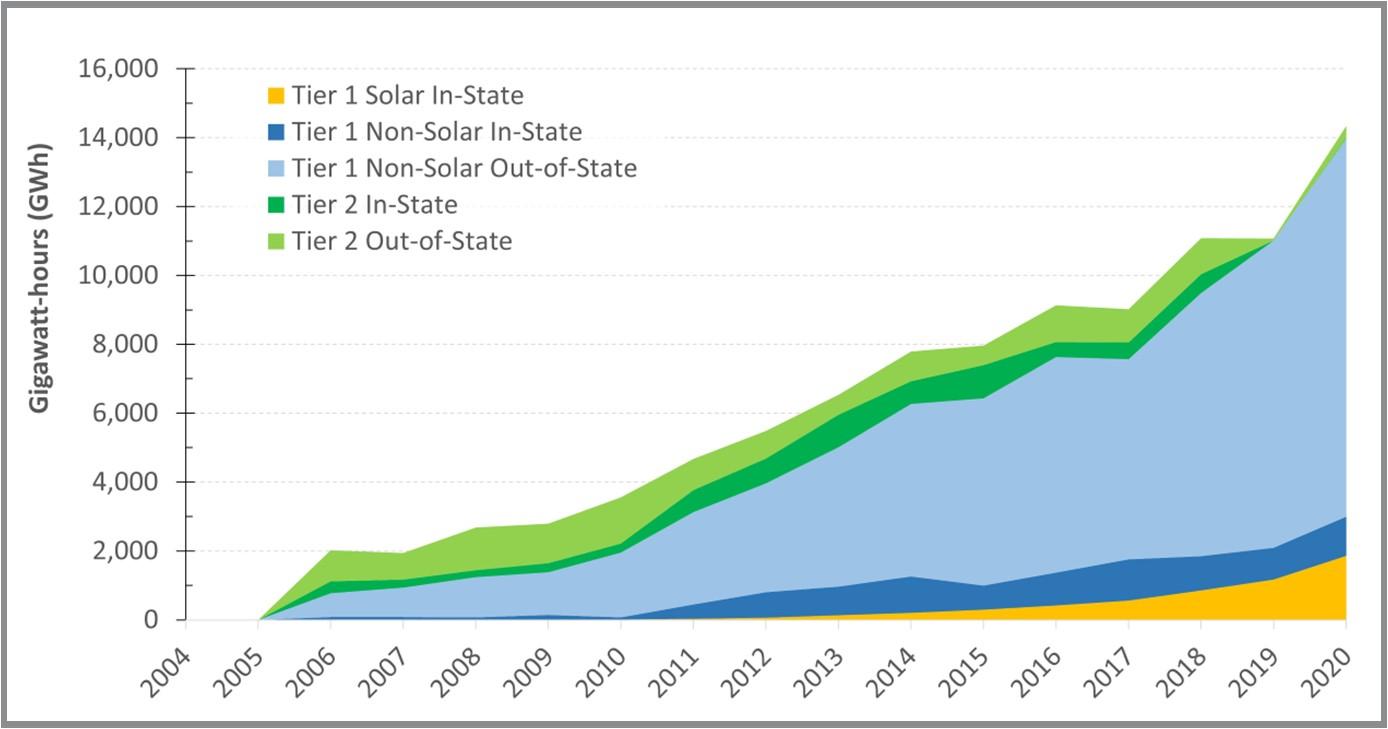
The RECs representing solar-generated electricity are commonly known as Solar Renewable Energy Certificates (SRECs). Owners of a solar PV system have the option of keeping SRECs or selling or assigning them to someone else. Retiring a REC or SREC means that the owner has used the certificate and it can no longer be sold. Utilities purchase RECs or SRECs to comply with RPS requirements, but corporations can purchase certificates to support renewable energy and offset their own operations by claiming the environmental benefits of the certificate. Figure 15 shows the volume and growth in RECs and SRECs retired in Maryland by fuel type since initiation of RPS requirements in 2006. Contributions from qualifying biomass sourced from agricultural crops, geothermal, other biomass liquid and gas, and solar thermal are too small to see on the chart.

Historically, most of Maryland’s RPS has been met by RECs from out-of-state resources, with the share of in-state RECs remaining relatively steady despite growth in the overall number of RECs retired (Figure 16). Out-of-state resources accounted for just over 79% of the RPS in 2020. Several factors contribute to the relatively low and constant number of in-state RECs retired in Maryland, including limitations in the availability of in-state RECs, the use of RECs produced in Maryland to comply with other state RPS policies, and the availability of RECs (presumably at lower cost) from other states. By utilizing out-of-state RECs, the Maryland RPS has contributed to renewable energy development in the rest of the PJM interconnection (a regional transmission organization serving 13 states and the District of Columbia), as well as neighboring regions by providing financial support to out-of-state resources.
Maryland has also enacted legislation to allow net metering (Maryland PSC, 2018) a billing arrangement that credits solar customers for the electricity added to the grid beyond the amount they consume during a particular billing period. Net metering typically requires installation of a special meter to measure electrical flow in both directions. When on-site production of electricity is low, the utility company will supply additional electricity. Alternatively, when on-site generation exceeds the electricity used, excess electricity is transferred to the grid so the customer receives an energy credit. Later, when energy from the grid is used (and while the solar array is not producing), the credit is cashed in for energy from the utility grid. The customer is billed only for the net amount of electricity consumed.
Under Maryland’s net-metering rules, credits expire each April. When credits expire, any excess credits in the account are paid to the solar owner at a rate close to the annual average electricity wholesale rate depending on specific policies differing by state. With HB 569, Maryland’s limit on net metered capacity was set to 3,000 megawatts (Maryland PSC, 2021).
See Figure 17 for an overview of mandatory net metering rules and state-specific policies for handling customer credits under net metering.

The increased awareness of carbon dioxide and smog emissions associated with fossil fuels is also driving increased deployment of solar PV. In 2009, Maryland adopted the Greenhouse Gas Emissions Reduction Act (GGRA) which required the state to reduce greenhouse gas (GHG) emissions 25% by 2020. The GGRA was reauthorized in 2016 to achieve a 40% reduction in emissions by 2030. The state’s 2030 GGRA Plan sets the more ambitious goal of a 50% reduction by 2030, while addressing environmental and climate issues in many ways, including several community solar programs to expand the benefits of access to renewable energy. See the 2030 Greenhouse Gas Emissions Reduction Act Plan (Maryland Department of the Environment, 2021) for more information.
According to a World Resources Institute report published in August 2020, Maryland is leading the nation in cutting emissions with a 38% reduction from 2005-2017 (Saha and Jaeger, 2020). Additional bills call for more ambitious goals, including a plan to achieve 100% clean and renewable electricity by 2040 through the Regional Greenhouse Gas Initiative (RGGI). The RGGI is a coalition of 11 east coast states to reduce carbon emissions.
References
- Arafa, M.I.A., & Said, E.S.S.A. (2019). A different vision for uninterruptible load using hybrid solar-grid energy. International Journal of Power Electronics and Drive Systems, 10(1), 381-387. Available from https://www.researchgate.net/publication/331445029_A_Different_Visions_for_ Uninterruptible_Load_using_Hybrid_Solar-Grid_Energy
- DSIRE. (2016). Net Metering Policies - Customer Credits for Monthly Net Excess Generation: September 2016. NC Clean Energy Technology Center. Available from https://ncsolarcen-prod.s3. amazonaws.com/wp-content/uploads/2019/07/NEG-1.20161.pdf
- DSIRE. (2020a). Net Metering: June 2020. NC Clean Energy Technology Center. Available from https://ncsolarcen-prod.s3.amazonaws.com/wp-content/uploads/2020/06/DSIRE_Net_Metering_June2020.pdf
- DSIRE. (2020b). Renewable & Clean Energy Standards: September 2020. NC Clean Energy Technology Center. Available from https://ncsolarcen-prod.s3.amazonaws.com/wp-content/uploads/2020/09/RPS-CES-Sept2020.pdf
- EIA, (2021a). Annual Energy Outlook 2021: With Projections to 2050. U. S. Energy Information Administration. Washington, DC. (February 3, 2021). Retrieved from https://www.eia.gov/outlooks/aeo/
- EIA. (2021b). Electricity Data Browser: Net generation for all sectors, Maryland, monthly 2001-2021. U. S. Energy Information Administration. Washington, DC. Retrieved from https://www.eia.gov/electricity/data/ browser/
- EIA. (2021c). Electricity Explained: Electricity in the United States. Energy Information Administration. Washington, DC. (March 18, 2021). Available from https://www.eia.gov/ energyexplained/electricity/electricity-in-the-us.php
- EIA. (2021d). Monthly Energy Review, August 2021:Table 7.2a – Electricity Net Generation, Total (All Sectors). U. S. Energy Information Administration. Washington, DC. DOE/EIA-0035(2021/8). (August 26, 2021). Retrieved from https://www.eia.gov/totalenergy/data/monthly/pdf/mer.pdf
- Feldman, D., Ramasamy, V., Fu, R., Ramdas, A., Desai, J., and Margolis, R. (2021). U. S. Solar Photovoltaic System and Energy Storage Cost Benchmark: Q1 2020 (No. NREL/TP-6A20-77324). National Renewable Energy Lab.(NREL), Golden, CO (United States). Available from https://www.nrel.gov/ docs/fy21osti/77324.pdf
- IEA. (2020). Snapshot of Global PV Markets 2020. International Energy Agency: Photovoltaic Power Systems Programme. IEA-PVPS T1-37: 2020. Available from https://iea-pvps.org/snapshot-reports/snapshot-2020/
- Lazard. (2020). Levelized Cost of Energy and Levelized Cost of Storage – 2020. Available from https:// www.lazard.com/media/451419/lazards-levelized-cost-of-energy-version-140.pdf
- Maryland Code, Public Utilities, § 7-701 (2018). Available from https://codes.findlaw.com/md/public-utilities/md-code-public-util-sect-7-701.html
- Maryland Department of the Environment. (2021). 2030 GGRA Plan. The Greenhouse Gas Emissions Reduction Act. (February 19, 2021). Available from https://mde.maryland.gov/programs/Air/ClimateChange/Pages/Greenhouse-Gas-Emissions-Reduction-Act-(GGRA)-Plan.aspx
- Maryland DNR. (2019). Final Report Concerning the Maryland Renewable Portfolio Standard as Required by Chapter 393 of the Acts of the Maryland General Assembly of 2017. Maryland Power Plant Research Program, Maryland Department of Natural Resources [PPES-MRPS-2019, 12-091619-167]. Available from https://dnr.maryland.gov/pprp/Documents/FinalRPSReportDecember2019.pdf
- Maryland PSC. (September 1, 2018). Report on the Status of Net Energy Metering in the State of Maryland: Prepared for the General Assembly of Maryland Under Public Utilities Article §7-306(h). Maryland Public Service Commission. Available from https://www.psc.state.md.us/wp-content/uploads/FINAL-2018-Net-Metering-Report.pdf
- Maryland PSC (2021). Solar in Maryland. Maryland Public Service Commission. Available from https://www.psc.state.md.us/electricity/wp-content/uploads/sites/2/Solar-in-Maryland-Fact-Sheet-1.pdf
- Maryland S.B. 516. (2019). Available from http://mgaleg.maryland.gov/2019RS/bills/sb/sb0516E.pdf
- PJM. (2021). MD – RPS Retired Certificates for Reporting Year 2004 – 2020. Generation Attribute Tracking System. Interconnection: Environmental Information Services (EIS). Available from https://gats.pjm-eis.com/GATS2/PublicReport/RPSRetiredCertificatesReportingYear
- REN21. (June 15, 2021). Renewables Global Status Report 2021: Solar PV Capacity Additions Passed 115 GW Mark in 2019. Renewables Energy Policy Network for the 21st Century. Paris, France. Available from https://www.ren21.net/reports/global-status-report/
- Ritchie, H. and Roser, M. (2020). Electricity Mix. Our World Data. Available from: https://ourworldindata.org/electricity-mix
- Rodziewicz, T., Zaremba, A., and Wacławek, M. (2016). Photovoltaics: Solar energy resources and the possibility of their use. Ecological Chemistry and Engineering, 23(1), 9-32. Available from https://www.researchgate.net/publication/301248496_Photovoltaics_Solar_energy_resources_and_the_possibility_of_their_use
- Saha, D. and Jaeger, J. (2020). Ranking 41 US States Decoupling Emissions and GDP Growth. World Resources Institute. Washington, DC. (July 28, 2020). Available from https://www.wri.org/insights/ ranking-41-us-states-decoupling-emissions-and-gdp-growth
- SEIA. (2021a). Solar Industry Sets Records in 2020, On Track to Quadruple by 2030. Solar Energy Industries Association. Washington, DC. (March 16, 2021). Available from https://www.seia.org/ news/solar-industry-sets-records-2020-track-quadruple-2030
- SEIA. (2021b). Solar State by State. Solar Energy Industry Association. Washington, DC. Available from https://www.seia.org/states-map
- SEIA. (2021c). State Solar Spotlight: Maryland Solar. Solar Energy Industries Association. Washington, DC. (August 2021). Available from https://www.seia.org/state-solar-policy/maryland-solar
- SEIA. (2021d). U.S. Solar Market Insight. Solar Energy Industries Association. Washington, DC. (September 14, 2021). Available from https://www.seia.org/us-solar-market-insight
- Wood Mackenzie. (2021). U.S. Solar Industry Sets Records in 2020, on Track to Quadruple by 2030. The US Solar Market Insight Q1 2021. (March 16, 2021). Available from https://www.woodmac.com/press-releases/u.s.-solar-industry-sets-records-in-2020-on-track-to-quadruple-by-2030/
Reviewed by:
- Daniel Bacellar, PhD
Center for Environmental Energy Engineering (CEEE) - Arjun Makhjani, PhD
Institute for Energy and Environmental Research - Fariborz Mahjouri, PhD, PE
Aurora Energy
| DREW SCHIAVONE dschiavo@umd.edu This publication, Solar Panels are Increasingly Common Sight on Urban and Rural Properties Across Maryland (EB-455), is a part of a collection produced by the University of Maryland Extension within the College of Agriculture and Natural Resources. The information presented has met UME peer-review standards, including internal and external technical review. For help accessing this or any UME publication contact: itaccessibility@umd.edu For more information on this and other topics, visit the University of Maryland Extension website at extension.umd.edu University programs, activities, and facilities are available to all without regard to race, color, sex, gender identity or expression, sexual orientation, marital status, age, national origin, political affiliation, physical or mental disability, religion, protected veteran status, genetic information, personal appearance, or any other legally protected class. |