Maryland's Solar Industry
This unit of the Farm Solar program explores the historical growth, current status, and potential growth of Maryland’s solar market in terms of its market share, use sectors, and current investments. This unit also addresses the deployment capacity and market potential for residential, commercial and utility-scale sectors within Maryland. Consideration is given to various solar initiatives, legislation, and other enabling policies currently impacting the solar market. By the end of this unit, you should be able to understand the history, identify the current growth rate, and define the current market share of solar photovoltaics in Maryland.
Photovoltaic History
Solar cells work based on the photovoltaic effect which was first observed by Alexander Becquerel in 1839 when he found that electrons would flow when light hit a piece of metal. The concept was not well understood until in 1950s when Bell Labs, now AT&T Labs, produced the photovoltaic cell or silicon solar cell. While photovoltaics were briefly considered for rural U.S. electricity production, the technology remained cost prohibitive for many practical applications. In the late 1950s, the U.S. defense programs looked at photovoltaics for energy in orbiting satellites in the space program, with the first commercial use of photovoltaics on the Vanguard 1 satellite in 1958. By the early 1970s, there were over 1,000 solar powered satellites with a cost around $100 per watt. For perspective, solar cells currently cost less than $2 a watt. Cost decreased slightly in the 1970s when photovoltaics found wider application in remote operations without electricity, like railroad crossings and road signs.
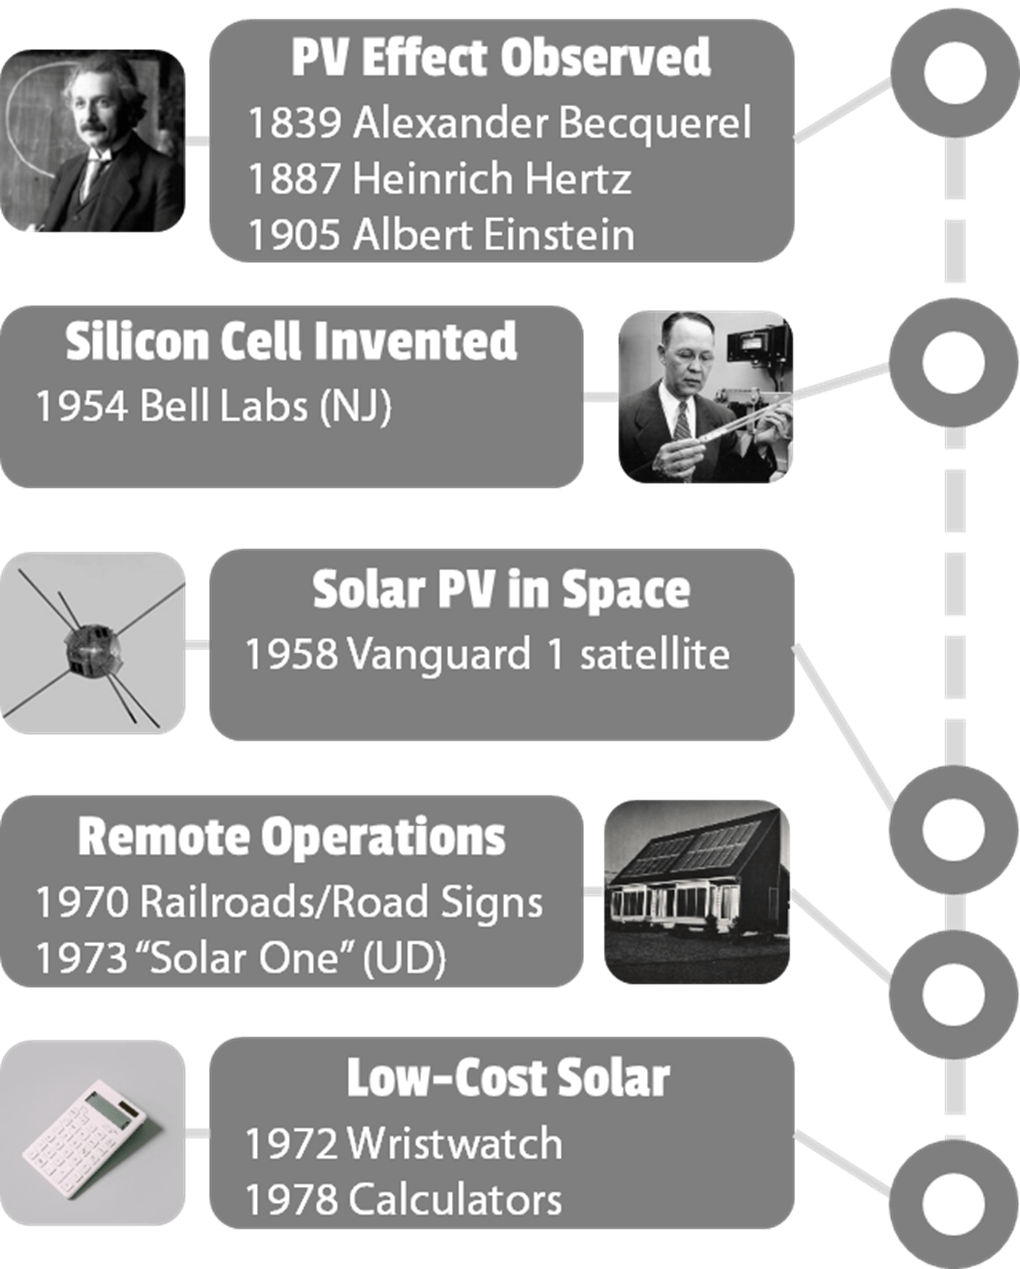
Modern photovoltaic manufacturing further matured with improvements in efficiency, as well as the invention of related technologies such as inverters and standardized components. While these advancements helped to improve the compatibility of solar photovoltaics with the electrical grid system, the U.S. oil crisis spurred further research and attention on solar photovoltaics in the late 1970s. Jimmy Carter installed the first photovoltaics on the White House in 1979, while small, low-powered solar cells found wider applications in calculators and watches in the 1980s. Photovoltaic prices continued to drop through the 1980s and 1990s as production increased in the U.S. California led the way in the U.S., while Germany and Japan led the adoption of large-scale photovoltaics from the 1990s onwards.
Market Share & Growth
Approximately 75% of all electricity use in the world is currently generated using fossil fuels with the remaining 25% coming from renewables (see Figure 12). Of this renewable portion, roughly 16% is derived from hydroelectric while only 3.0% is sourced from photovoltaics. While hydro-power currently forms a larger portion of our renewable energy portfolio for electricity, photovoltaics are one of the largest areas for growth. Since 2006, annual photovoltaic growth has exponentially grown each year as seen in Figure 11. While there was a global recession in 2009 through 2011, solar continue to increase its employment, capacities and total installations each year. By early 2020, the solar industry estimated about 627 gigawatts of photovoltaics were installed, representing a 3.0% share of total electricity consumption. Using an average amount of sunlight and external efficiency numbers, this conservatively places us over 800 terawatt hours per year of solar electricity.

|

|
U.S. capacity of solar photovoltaics is also increasing each quarter with rather large fourth quarter changes, particularly in the utility sector (see Figure ##). The utility sector is what we commonly consider solar farms, or utility-based installations for large, centralized generation. Note that hydroelectric power has remained relatively stagnant in recent years due to fairly consistent number of hydroelectric facilities in operation, as well as the limited geographic resource associated with hydropower. Similar trends are observed in Maryland with the state’s net electricity generation becoming less dependent on fossil fuels and the renewable portion of the state’s energy consumption increasing (see Figure 15).
|

|
While California had remained a strong leader in photovoltaic growth for many years, the ranking of other U.S. states have fluctuated due to ever-changing legislation and financial metrics (see Figure 14). Maryland’s ranking, for instance, has fluctuated between the 10th and 16th position since 2012. Maryland’s ranking as of the second quarter of 2020 is shown in Table 2. The financial and legislative changes impacting these rankings are a combination of net metering rules, state, local incentives, and/or private development. For Maryland, it has largely come from a combination of the state’s Renewable Portfolio Standard, as well as some other state incentives that have led to large utility-scale installations.

| State | MW Installed |
Number of Installations |
Number of Solar Jobs |
|---|---|---|---|
| California | 28,471.51 | 1,173,243 | 74,255 |
| North Carolina | 6,451.05 | 17,788 | 6,617 |
| Arizona | 4,765.73 | 164,236 | 7,777 |
| Florida | 5,577.67 | 66,466 | 12,202 |
| Texas | 5,577.44 | 76,584 | 10,261 |
| Nevada | 3,612.85 | 58,026 | 7,000 |
| New Jersey | 3,386.41 | 125,587 | 6,225 |
| Massachusetts | 2,849.47 | 106,772 | 10,400 |
| Georgia | 2,664.39 | 2,039 | 4,798 |
| New York | 2,401.95 | 133,204 | 10,740 |
| Utah | 1,799.20 | 41,001 | 7,107 |
| Colorado | 1,513.95 | 71,257 | 7,174 |
| Minnesota | 1,462.89 | 7,482 | 4,335 |
| South Carolina | 1,477.10 | 21,233 | 3,307 |
| Hawaii | 1,361.94 | 88,641 | 2,484 |
| Maryland | 1,263.37 | 70,378 | 4,854 |
| Virginia | 1,099.65 | 12,586 | 4,489 |
| New Mexico | 1,068.33 | 24,380 | 2,021 |
| Oregon | 880.94 | 20,928 | 3,750 |
| Connecticut | 786.02 | 47,535 | 2,234 |
Economic & Policy Drivers
There are many reasons for these increasing trends in photovoltaic usage across the world, and locally, within the state of Maryland. In some developing countries, and even in rural areas in the U.S., access to traditional energy sources may be limited. Take for instance China's increased demand for energy, which cannot be met by their limited fossil resources. Likewise, grid-connected utilities may be cost-prohibitive or unavailable to some rural and remote areas within Maryland. In these cases, rural electrification may drive solar photovoltaic development over some more traditional fuels.
In recent years, solar has also become much more cost competitive with traditional energy sources, even having grid parity, or equaling the cost of fossil fuels. In fact, there are currently over 30 countries in the world where photovoltaic technologies are already less expensive than traditional electrical technologies, and can be profitable without additional financial incentive support. This is particularly true in countries where traditional electricity production is very expensive because of high fuel or distribution costs. In any sense, photovoltaic costs are exponentially declining as materials and manufacturing efficiencies improve (see Figure 14). Major supply increases, like raw materials of silicon in the mid-2000s, led to a sharp decrease in the cost of manufacturing. The price of photovoltaics in 1976 were around $100 per watt, but are currently much closer to $1 or under per watt. With that said, the declining trend in photovoltaic costs is slowing down for most of the U.S. with unavoidable soft costs (such as utility integration and permitting) remaining.

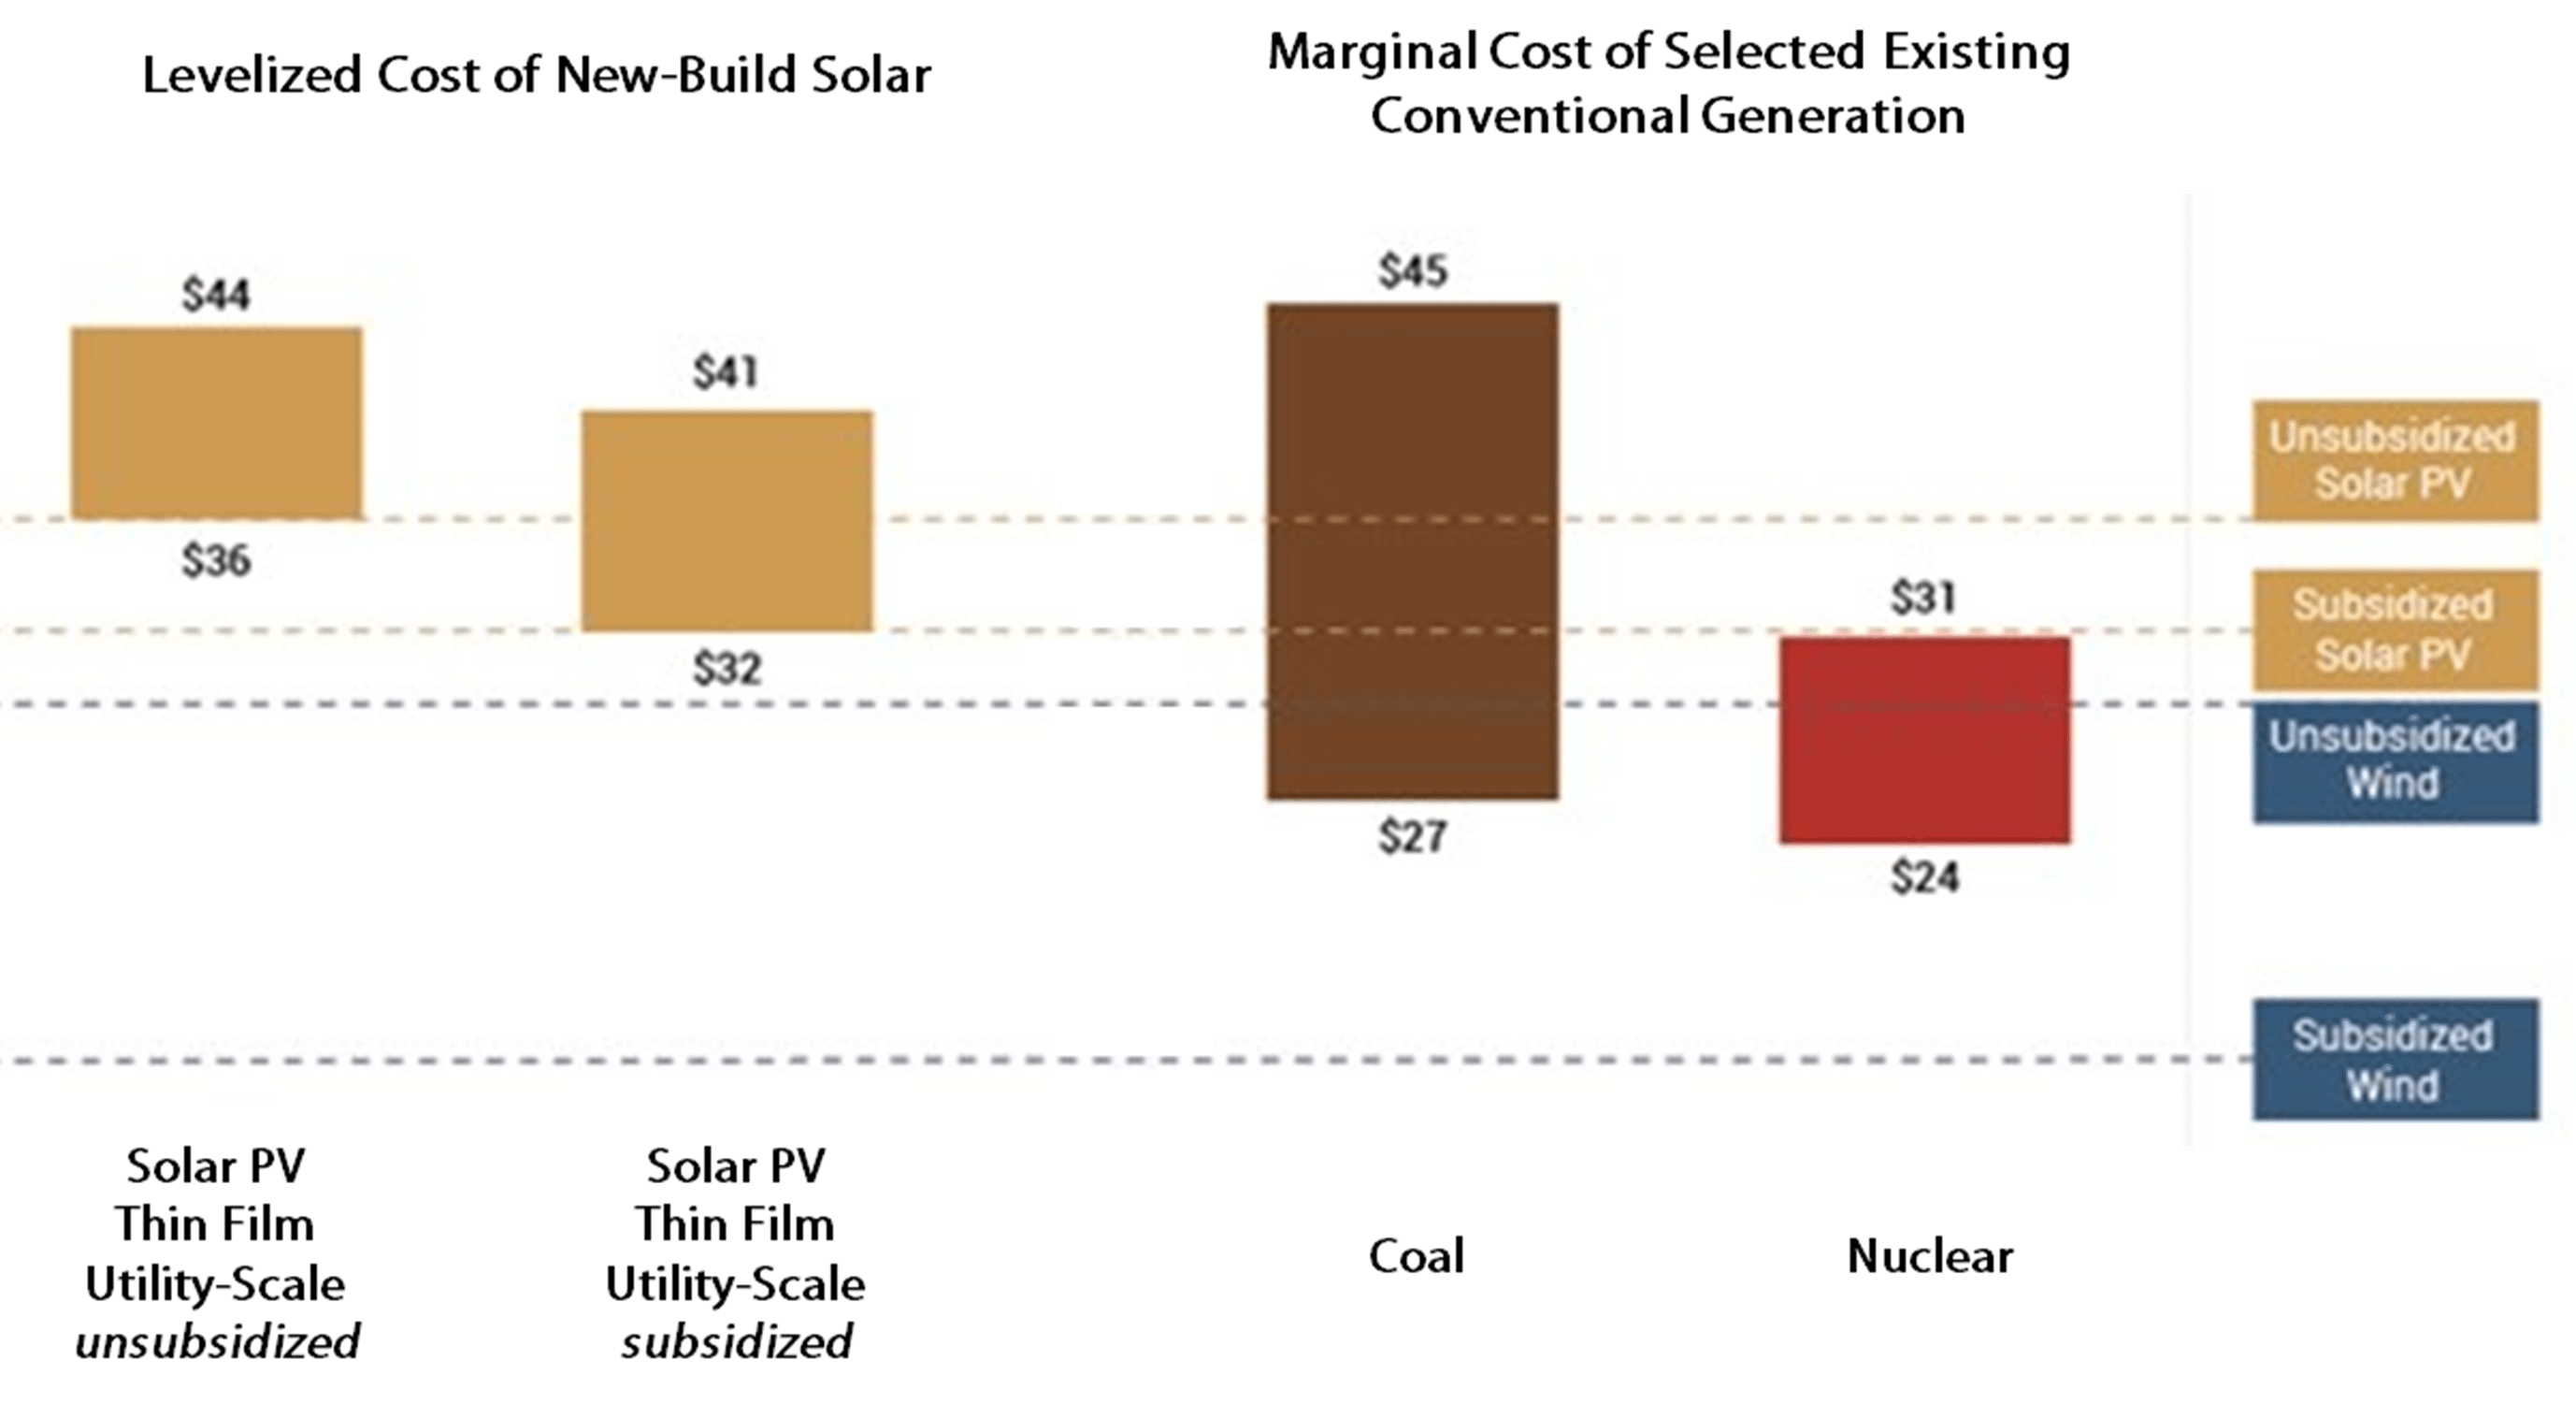
Considering solar photovoltaic crystalline and thin film utility scale systems, the levelized cost is less than virtually any conventional electricity technology (see Figure 15). Levelized cost takes into the account the cost of maintenance and operation, as well as the fuel and the technology. Conventional energy sources, like natural gas and coal and nuclear, have significant operation and maintenance costs, as well as fuel costs. With photovoltaics, the fuel is free because it is sunlight, and there are limited operation or maintenance costs. While photovoltaics may have a higher installation cost per energy unit, renewable energy systems such as photovoltaics become clear winners when you consider the lifetime of the technology.
While large portions of Europe and Asia have national renewable energy policies in place, state-level requirements are currently implemented in the U.S. Figure 16 shows the number of countries with renewable energy policies in place. When national and NGO programs incentivize photovoltaic installations and trainings, there are usually some financial measures in place to support more affordable solar photovoltaics.

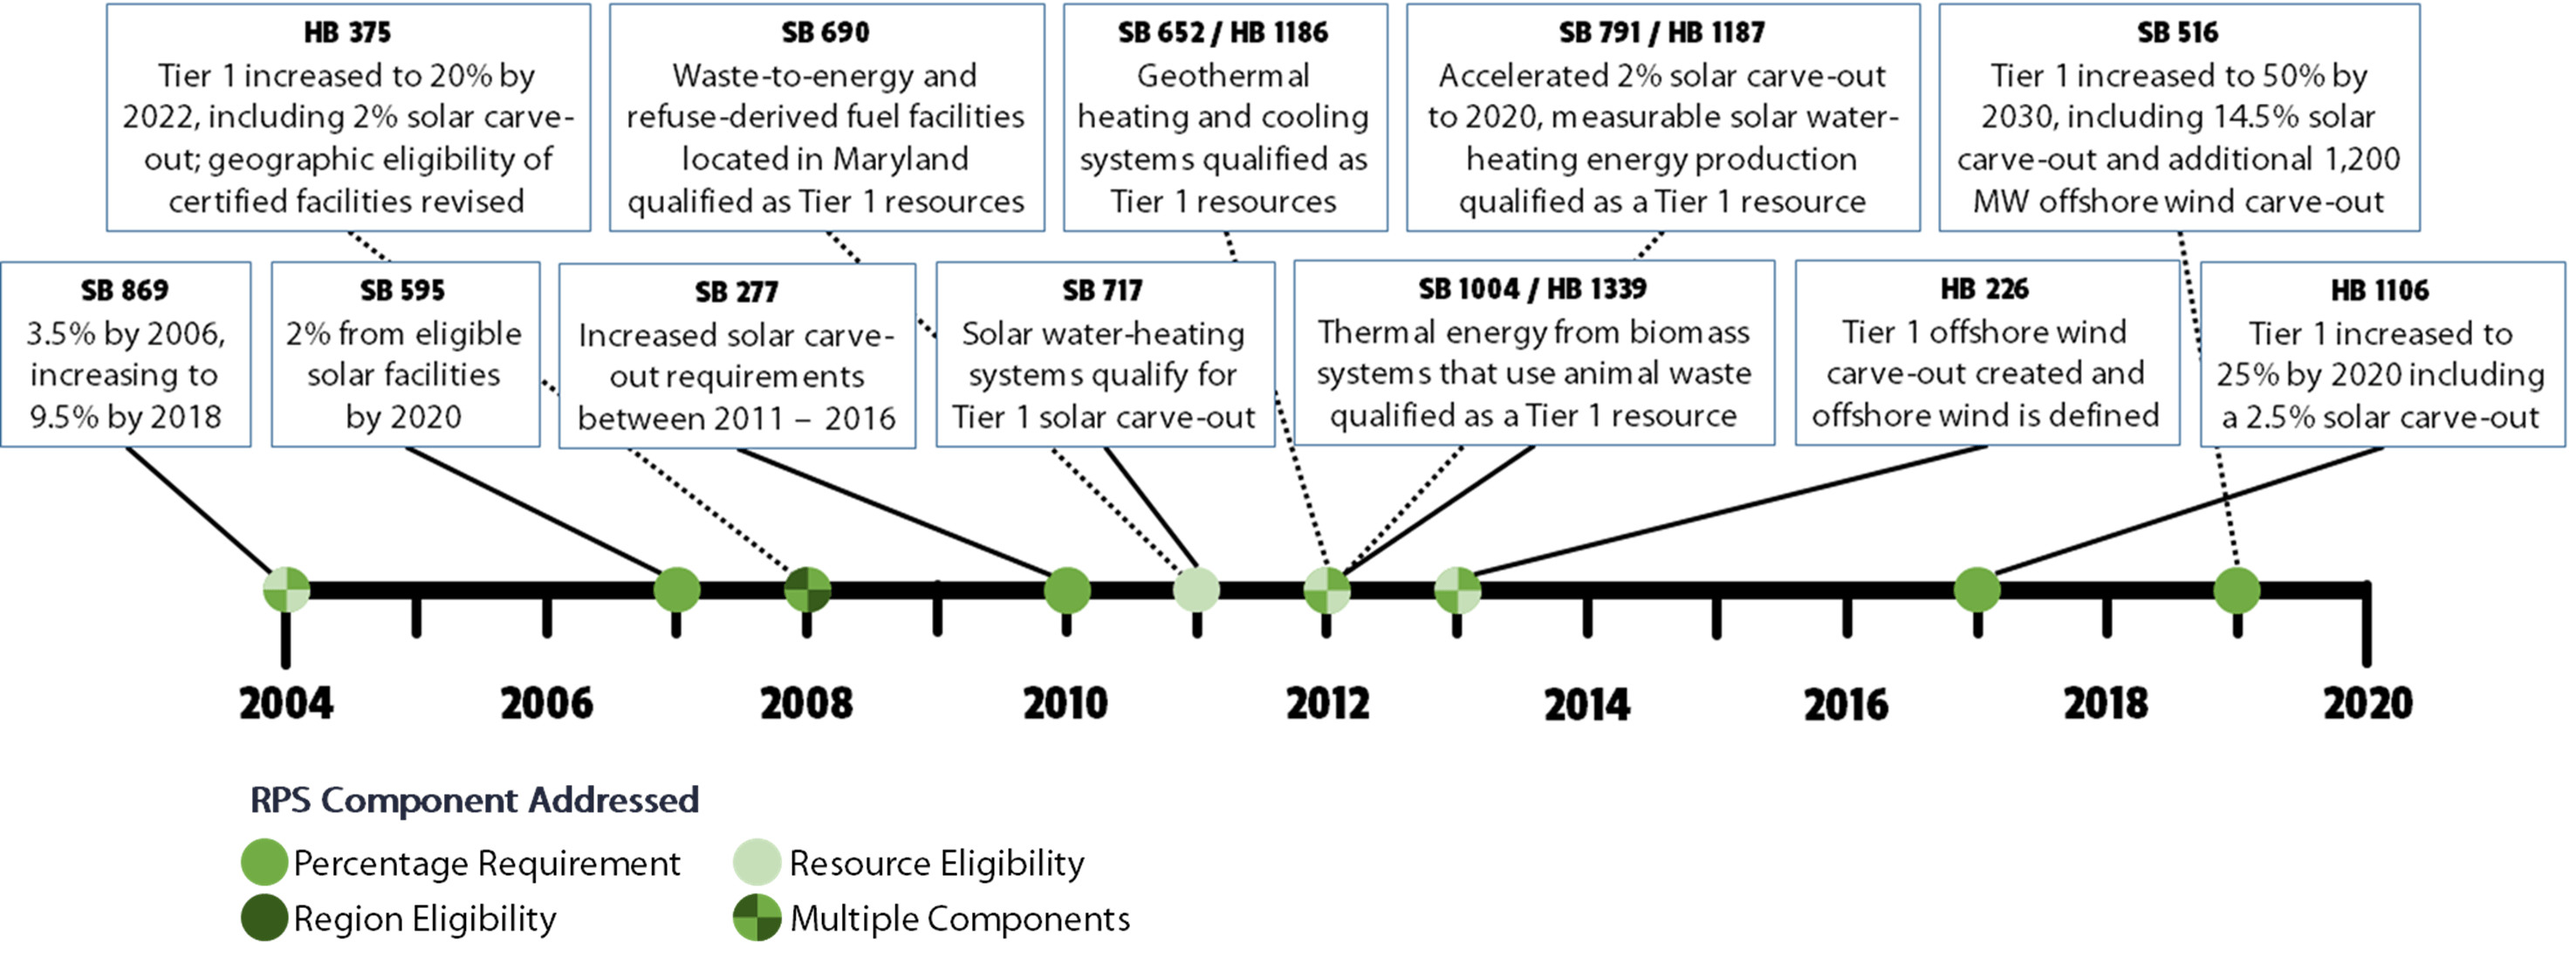
Like many other states (see Figure 17), Maryland has given more priority to renewable energy sources in recent years with the state's legislature enacting a renewable portfolio standard (RPS) starting back in 2004. Several amendments have been made to the Maryland’s RPS since then (see Figure 18), including the latest update in May 2019, requiring 50% of the state's electricity retail sales to come from renewable sources by 2030. As part of the updated RPS, 14.5% of an electricity supplier's retail sales must come from solar power by 2030. The RPS also requires that the state's offshore wind generating capacity reach 400 megawatts in 2026 and increase to at least 1,200 megawatts in 2030.

The state’s Renewable Portfolio Standard requires a certain percentage of the energy sold by each utility to come from renewable sources. Utilities and retail suppliers measure their compliance with the RPS using Renewable Energy Certificates (RECs) which are created whenever renewable sources generate electricity (one megawatt-hour of electrical generation equals one REC). As such, RECs represent the environmental value of renewable energy; while adding a secondary revenue stream for investments since RECs can be bought and sold. RECs initially belong to whoever owns the renewable energy system, giving them the legal right to claim the use of the corresponding renewable energy. This right is valuable to utilities in terms of meeting Maryland’s RPS, as well as businesses that may be interested in claiming the use of that renewable energy.
The RECs representing solar generated electricity are commonly known as Solar Renewable Energy Certificates (SRECs). When you own a solar photovoltaic system, you have the option of keeping your SRECs or selling or assigning them to someone else. Retirement of a REC or SREC means that the certificate has been used by the owner (it can no longer be sold). Utilities purchase RECs or SRECs to comply with RPS requirements, but corporations may purchase certificates to support renewable energy and offset their own operations by claiming the environmental benefits of the certificate. Figure 19 shows the volume and growth in RECs retired in total and by fuel type from the beginning of the RPS requirement in 2006, as well as the solar carve-out RECs retired in Maryland. Note that the contributions from qualifying biomass sourced from agricultural crops, geothermal, other biomass liquid and gas, and solar thermal are too small to be seen on this chart.

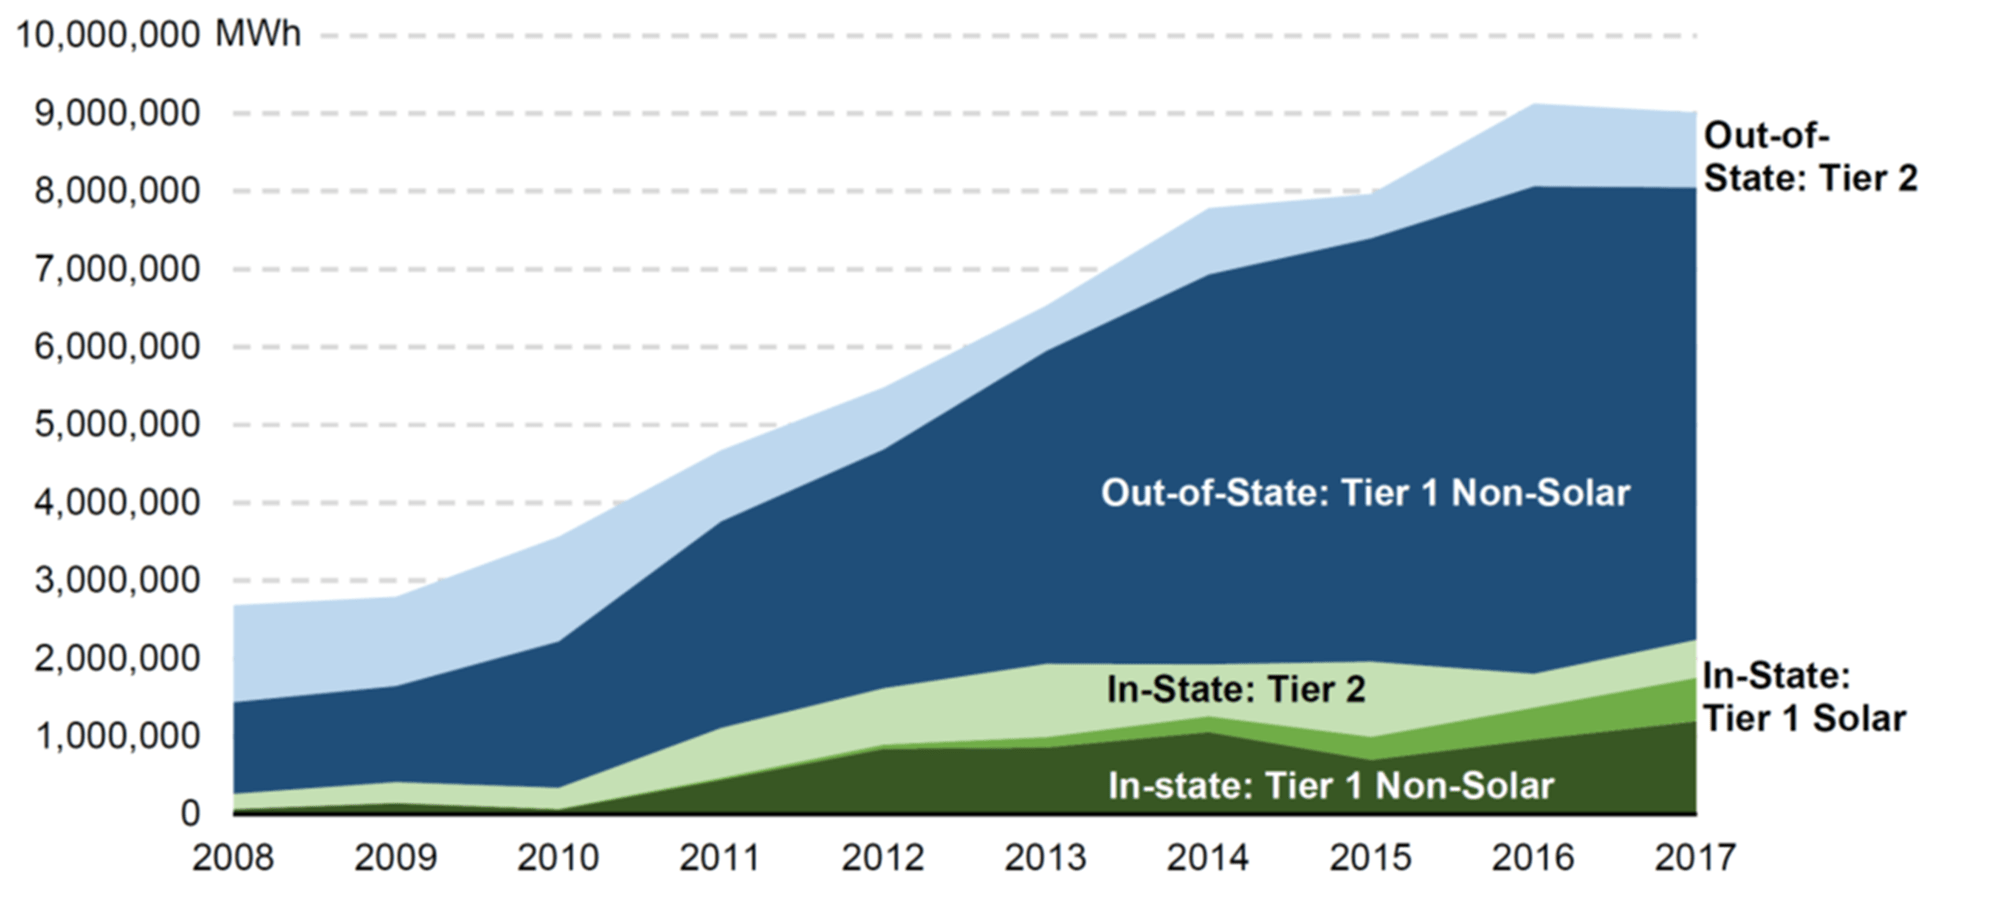
Historically, most of Maryland’s RPS has been met by RECs from out-of-state resources (see Figure 20). This share has remained relatively flat since 2011 despite growth in the overall number of RECs retired. According to the Maryland Public Service Commission’s most recent RPS Report, about 75% of the RPS is met through out-of-state resources as of 2017.39 There are several potential reasons that the total number of in-state RECs retired for the Maryland RPS has remained a constant share, including: limitations in the availability of in-state RECs, the use of RECs produced in Maryland to comply with other state RPS policies, and the availability of RECs, presumably at lower cost, from other states that can be used to comply with Maryland’s RPS. Nevertheless, as a result of utilizing out-of-state RECs, the Maryland RPS has contributed to renewable energy development in the rest of PJM and in neighboring regions by providing financial support to out-of-state resources in the form of REC payments.
Maryland has also enacted legislation to encourage net metering which is an electricity billing arrangement that credits solar customers for the electricity they add to the electricity grid beyond the amount they consume during a particular billing period. Net metering typically requires the installation of a special electric meter to measure electrical flow in both directions. When on-site production of electricity is low, additional electricity will be supplied by the utility company. Alternatively, when on-site generation exceeds the electricity being used, excess electricity is transferred to the electrical grid while the customer receives an energy credit. Later, when energy is used but the solar array is not producing, the credit is cashed in for energy to from the utility grid. At the end of the billing period, the customer is billed only for the net amount of electricity consumed. Under Maryland’s net-metering rules, credits expire in April each year. When credits expire, any excess credits in the account are paid to the solar owner at a rate close to the annual average electricity wholesale rate depending on state-specific policies (see Figure 22).

The increased awareness of carbon dioxide and smog emissions associated with fossil fuels is also a driver for increased solar photovoltaics from environmental and global health perspectives. In 2009, Maryland adopted the Greenhouse Gas Emissions Reduction Act (GGRA) which required the state to reduce greenhouse gas (GHG) emissions 25% by 2020. The GGRA was reauthorized in 2016 to achieve a 40% reduction in emissions by 2030, while the state’s 2030 Greenhouse Gas Reduction Act (GGRA) Plan sets the more ambitious goal of 50% reduction by 2030. Environmental and climate justice issues are addressed in the 2030 GGRA Plan in many ways including several community solar programs to expand the benefits of access to renewable energy. According to a World Resources Institute report published in August 2020, Maryland leads the nation in the amount of emissions reductions (38%) in a 12 year period. Additional bills have called for more ambitious goals including a plan to achieve 100% clean and renewable electricity by 2040 through the Regional Greenhouse Gas Initiative (RGGI) which is a coalition of 11 east coast states working together to reduce carbon emissions.
With that said, solar photovoltaics are currently considered to be a mature technology with large investments and broad adoption across the U.S., and within the state of Maryland. Solar photovoltaic generation, particularly at the utility-scale, is now growing at a faster rate, and with higher generation, than distributed electrical and it's projected to stay higher moving forward. Electricity generation from renewables, including solar photovoltaics, is expected to increase as a result of declining costs of solar and wind renewable capacity, making these fuels increasingly competitive (see Figure 26 and Figure 27).

Now that we’ve highlighted Maryland’s diverse energy landscape, let's look at how we can use solar photovoltaics as a resource to deliver the electricity that we need to meet our demands.
Other units in this module:
| Maryland's Solar Market Length: 55:14 Date: September 30, 2020 Dr. Drew Schiavone Download Slide Deck (pdf) |