
FS-1140 | November 2020
Considerations for Shell Use in Oyster Rehabilitation Assessing the Effectiveness of Multiple Options
Abstract
Oyster shell from processing plants (aka shucking house shell or green shell) represents a byproduct that remains after the meat has been removed from the animal. Shell has historically been used to attempt to enhance natural recruitment and support commercial production of oysters by providing a place for larvae to attach and grow.¹ Since the 1980s, declining oyster production led to the loss of most processing plants that produced this and currently unavailable mined fossil shell deposits have contributed to a severe lack of material to rebuild the resource and fishery. Recent successes using hatchery-produced seed for public and private fisheries has increased demand for whole shell and made it a valuable resource. This paper compares three uses for shucking house shell in the production of seed and market oysters. We provide calculations for comparisons based on a standard unit of 1,000 bushels of processing plant-derived shell for all comparisons unless otherwise noted.
Background
Calculations for comparisons in this report are complex and include more assumptions than those in our companion publication on analyzing power dredging.² We quantify the loss of shell volume or mortality of spat and oysters based on data derived from years of large-scale spat production and follow-up monitoring of hatchery reared seed for restoration projects in Maryland.
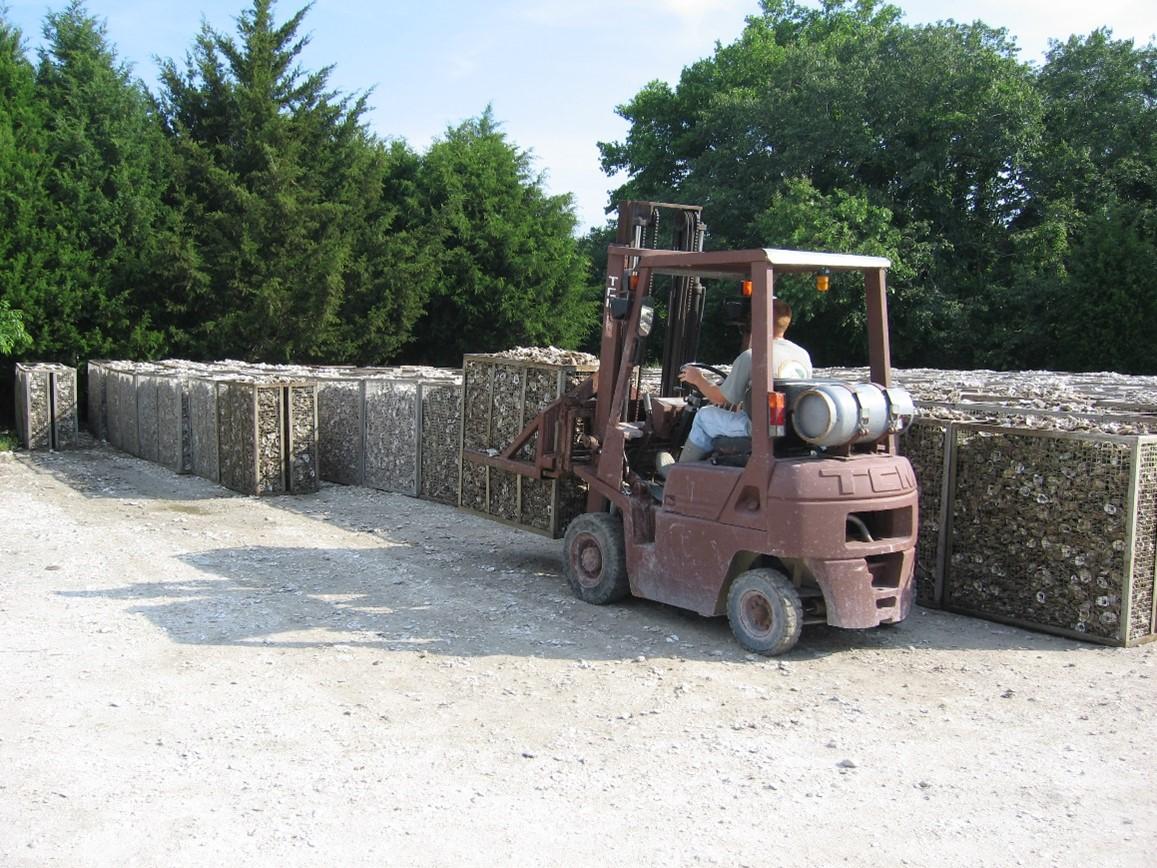
Shucking house shell contains mud, sand, shell bits, and other unsuitable materials within its volume which are not usable as setting substrate regardless of the technique used. Experience with processing shells at the University of Maryland Center for Environmental Science Horn Point Oyster Hatchery has shown that approximately 20% of shell volume is comprised of these ‘fines’ which are removed prior to hatchery setting by pre-washing. This material is, therefore, not available for the setting process, either in tanks or the environment.
Loss of shell volume also occurs due to inconsistent bottom and difficulty in deploying shell uniformly across an area. This affects all techniques at one or more points during deployment and grow-out. Loss of either shell or spat on shell during phases of these techniques have been grouped and listed as “post deployment loss.” Explanation of the causes of loss and descriptions of how estimates were obtained are discussed under individual techniques.
Technique One: Wild Seed Production
This is the oldest method used to enhance oyster populations and relies on natural spat left in place for ultimate harvest. Shell is purchased, either by the State or private planters, transported to a chosen site and deployed. Naturally occurring larvae from spawning oysters attach to these shells during metamorphosis and the resulting seed is left in place to grow to harvestable size.³ Shell is only moved once during this method and losses due to unsuitable bottom or uneven deployment (i.e., post-deployment loss) are factored into the calculations.
Technique Two: Wild Seed Production for Transplant
In this technique, shell is deposited in locations believed to attract larval settlement. However, after larvae attach, the seed is transplanted to alternate sites to grow to market size. Since shell and spat are moved twice, loss of shell or spat due to unsuitable bottom or uneven deployment are greater than in Technique One. No studies could be found to document survival data for redeployed spat. Oyster programs from other North American areas were queried to obtain a “best estimate” for survival. Commercial shellfish businesses in Virginia, Massachusetts, Washington, and New Brunswick, Canada were polled with similar results. Estimates of seed surviving to harvest after deployment ranged from 10% to 25% and were similar to data on hatchery seed survival documented by Maryland scientists monitoring large-scale restoration plantings at several locations in Chesapeake Bay.⁴
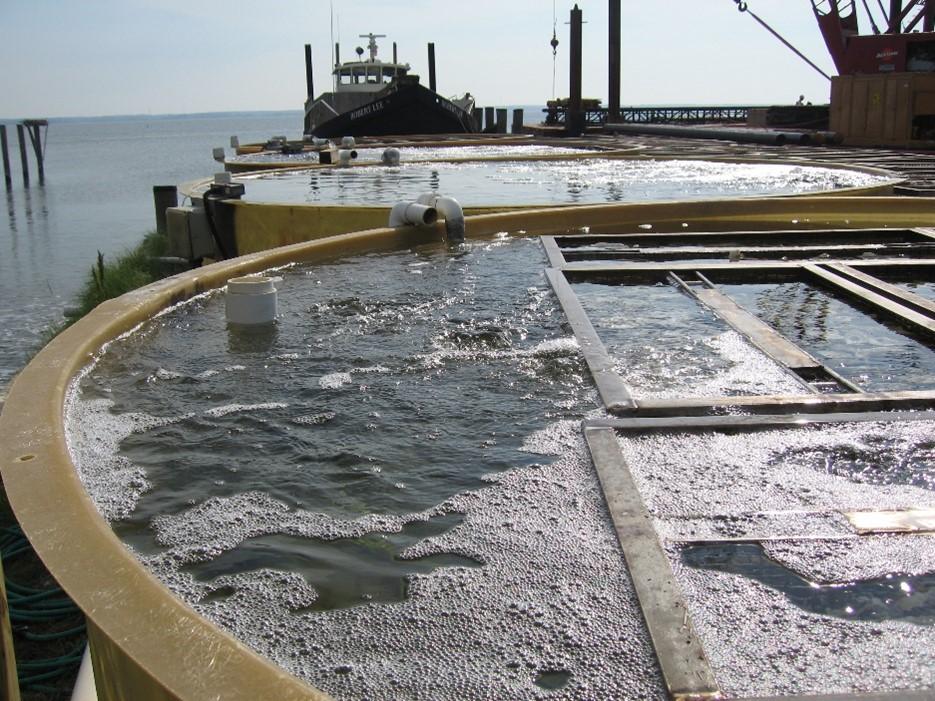
Technique Three: Hatchery Produced Seed
To produce hatchery seed, shell is purchased and transported to a storage site to remain for a minimum of one year to ensure that all organic matter attached to it has decomposed. After aging, the shell is washed, graded, containerized and placed in setting tanks. Hatchery larvae are introduced into the setting tank filled with water which is gently aerated to circulate larvae throughout the shells until setting occurs.⁵ Resulting spat are left in the tank for several days to a week with ambient water pumped through them to provide natural food. They are then removed and transported to a site for growout to harvest. For more than a decade, hatchery seed has been monitored and data collected on survival. Spat placed on suitable bottom exhibits approximately 70% mortality during the first two months after deployment. Studies have shown the importance of proper bottom characteristics for robust survival. Planting spat on poorly prepared or unsuitable bottoms will result in significant losses regardless of the technique used.
Uniform deployment of shell in large quantities is not easy to accomplish. Homogeneity of bottom is rare at most sites. Since shell deployment is variable, estimates are based on data from other studies or examples from other restoration or production areas.⁶ Additional experimentation providing more accurate data will allow increased accuracy of comparisons.
Oysters experience mortality during grow-out from predation, disease, and other factors. Data from hatchery seed shows that natural mortality in most healthy oyster populations in Chesapeake Bay is 10% to 15% annually after initial loss of newly set spat, which occurs within the first two to three months after setting. Estimates from other regions compare well with this data and show similar losses. Oyster survival predictions from Technique Two are approximately 20% while hatchery seed survival has been calculated at approximately 24%. Estimates for spat survival from Technique One are poor at best. However, using data from survival of newly settled hatchery seed (30%) and applying the same annual mortality used in both other techniques (10%) yields overall survival from settlement to market for Technique One as approximately 24%. Given the wide range of conditions under which these techniques have been used, the overall survival for oyster spat is remarkably similar.
It is apparent that more extensive studies are required to understand the factors contributing to overall mortality and resultant survival. However, estimates that include such a wide range of locations and techniques are so similar that it is highly probable that they are reasonably accurate and can be used to evaluate and compare these techniques in Maryland.
Production of Spat and Market Oysters
Each technique has the potential to produce oyster spat and market oysters, but variables exist that influence their effectiveness. Techniques One and Two rely on natural recruitment for spat production. Once deployed, this new shell will behave similarly to shell already in place on bottom at each site. Temporal and spatial variation in recruitment affects these shells as shown in the authors’ power dredging analysis. Therefore, hatchery seed is generally more reliable. After post-deployment mortality is considered, hatchery-produced seed approximates densities found in Maryland’s best seed-producing regions during the 1960’s, a period that is considered the most productive for natural recruitment. Spat from natural recruitment are close to one year old; therefore, the initial mortality experienced with young hatchery seed allows us to make meaningful comparisons.
Table 1 compares the estimated production of spat from three techniques utilizing shucking house shell under a variety of natural recruitment levels. Natural recruitment data has been obtained from results of the annual oyster bar survey conducted by the state management agency. This traditionally has exhibited highly variable results in measured spat per bushel counted.⁷ Hatchery seed production is based on data from the Horn Point Oyster Hatchery during 2011-2013.
| Natural Recruitment (spat/bushel) |
Technique 1‒No Redeployment | Technique 2‒Redeployment | Technique 3‒Hatchery |
|---|---|---|---|
| 2 | 2 | 0.6 | 7,069 |
| 10 | 12 | 3 | 7,069 |
| 100 | 118 | 29 | 7,069 |
| 500 | 589 | 145 | 7,069 |
| 1000 | 1,178 | 291 | 7,069 |
Table 1 demonstrates that an efficient hatchery can utilize shell more effectively than that placed in the wild with natural recruitment similar to Maryland’s Chesapeake Bay. An important component needed for meaningful comparison of techniques is the cost-to-benefit ratio. Some costs, like the purchase price of shell, are fairly constant across techniques while others like hatchery costs are only applicable to a single option. For comparison, total shell costs are estimated to be $5.50 per bushel, which includes the purchase price of shell and accumulated costs of transportation to the initial site. These are estimated to be similar throughout all techniques.
Technique Two requires initial purchase and deposition of shell plus additional transport to a final deployment site, which has been estimated at $2 per bushel. Hatchery costs are estimated based on experience at the Horn Point Hatchery during 2011-2013. Estimates for production of market oysters from an initial input of 1,000 bushels of shucking house shell are:
- Technique One = $5,500
- Technique Two = $7,500
- Technique Three = $30,900
These estimates will become more accurate as better studies are undertaken; however, by utilizing these estimates, it is possible to calculate estimated cost for a bushel of market oysters produced by each technique. Table 2 illustrates production costs per bushel for market oysters by each technique throughout a range of recruitment variables.
| Spatfall level | Technique 1--No Redeployment | Technique 2--Redeployment | Technique 3-- Hatchery |
|---|---|---|---|
| 10 spat/bushel | $375.00 | $2,166.67 | $4.37 |
| 100 spat/bushel | $38.14 | $224.13 | $4.37 |
| 500 spat/bushel | $7.64 | $44.83 | $4.37 |
| 1000 spat/bushel | $4.69 | $22.34 | $4.37 |
Conclusions
These comparisons demonstrate that the most cost-effective and regularly productive use for whole oyster shell is by pro-duction of hatchery seed. This results in increased levels of spat and market oysters through consistent and reliable supply of seed and, ultimately, marketable product. While having a higher production cost for spat, increased efficiency compensates for this. Natural recruitment must approach 1,000 spat per bushel to approach the cost-effectiveness of hatchery seed production. It would also have to be: a) regular by year and location, and; b) predictable throughout annual variations in weather patterns, especially rainfall which affects salinity. Natural recruitment of spat of this magnitude and under those criteria is not possible in Maryland.
These comparisons focused on the production of market oysters, but they similarly apply to restoration projects for habitat enhancement. The current shortage of whole oyster shell and demonstrated differences in cost effectiveness for its use contradicts using techniques that fail to incorporate scientific and economic factors into allocating this valuable but limited resource.
These scenarios do not incorporate some potential multi-year benefits that may accrue from oyster restoration. Numbers generated in these calculations assume that all shell or oysters will be harvested from a given site. However, uniform harvest is unlikely because of the poor efficiency of equipment that is used commercially. For example, when estimating harvest numbers for an acre of oyster bottom, oysters will remain after harvesting has reduced the density on the bottom below that deemed profitable to remove. Additionally, those oysters, and the shell that remains in situ, could potentially serve as cultch for future larval oysters to attach or they could be buried under sediment However, the calculations used in this document apply when attempting to determine actual numbers of spat and market oysters although at a rate reduced by the volume of the material removed.
The number of years that it takes to largely eliminate positive influences by management activities will vary by site. However, given the poor record of regular natural recruitment in many regions of Chesapeake Bay, there are still extensive regions where natural recruitment alone is unlikely to result in any significant increase in oysters. Hatchery production is therefore
more predictable and can be used to create populations for annual harvest when properly planned and implemented.
References
¹Kennedy, V.S. and L. L. Breisch. 1983. Sixteen Decades of Political Management of the Oyster Fishery in Maryland’s Chesapeake Bay. University of Maryland Center for Environmental Science, Contribution No. 1332 HPL UMCES.
²Meritt, D. and D. Webster. Predicting Oyster Production: A Comparison of Natural Recruitment and Aquaculture. University of Maryland Extension Oyster Management series.
³Kennedy, V.S., Breitburg, D. L. et al. 2011. Lessons Learned From Efforts to Restore Oyster Populations in Maryland and Virginia, 1990 to 2007. Journal of Shellfish Research. Vol. 30, No. 3, 719-731.
⁴Spitznagel, M., A. Handschy & K. Paynter. 2015. 2014 Cook Point Oyster Sanctuary Survey: Paynter Lab, University of Maryland.
⁵Webster, D., D. Meritt & S. T. Alexander. 2019. Remote Setting Systems. University of Maryland Extension manual UM-OA-19-03.
⁶Paynter, K., A. Michaelis & A. Handschy. 2014. Paynter Lab Annual Monitoring and Research Summary 2013. Department of Biology, University of Maryland, College Park. MD.
⁷Tarnowski, M. et al. 1996-2019. Maryland Oyster Population Status Report Annual Fall Survey. Maryland Department of Natural Resources, Annapolis, MD.
DONALD WEBSTER
dwebster@umd.edu
DONALD MERITT
dmeritt@umces.edu
This publication, Considerations for Shell Use in Oyster Rehabilitation Assessing the Effectiveness of Multiple Options (FS-1140), is a part of a collection produced by the University of Maryland Extension within the College of Agriculture and Natural Resources.
The information presented has met UME peer-review standards, including internal and external technical review. For help accessing this or any UME publication contact: itaccessibility@umd.edu
For more information on this and other topics, visit the University of Maryland Extension website at extension.umd.edu
University programs, activities, and facilities are available to all without regard to race, color, sex, gender identity or expression, sexual orientation, marital status, age, national origin, political affiliation, physical or mental disability, religion, protected veteran status, genetic information, personal appearance, or any other legally protected class.